![]()
Studies on COVID-19 pandemic status Worldwide
Within these difficult and challenging circumstances brought by the coronavirus (COVID-19) pandemic, all of us are mainly concerned on how to keep ourselves and our families safe and in good health. But we are also thinking on how to contribute both as scientists and as responsible citizens.
Since the outbreak of this pandemic, the NANOTEXNOLOGY Organizing Committee is constantly monitoring and study the situation in Europe and worldwide. We follow daily the published reports and statistics, together with the measures implemented by the national governments to limit the spread of the COVID-19 virus and we are also in contact with the responsible authorities.
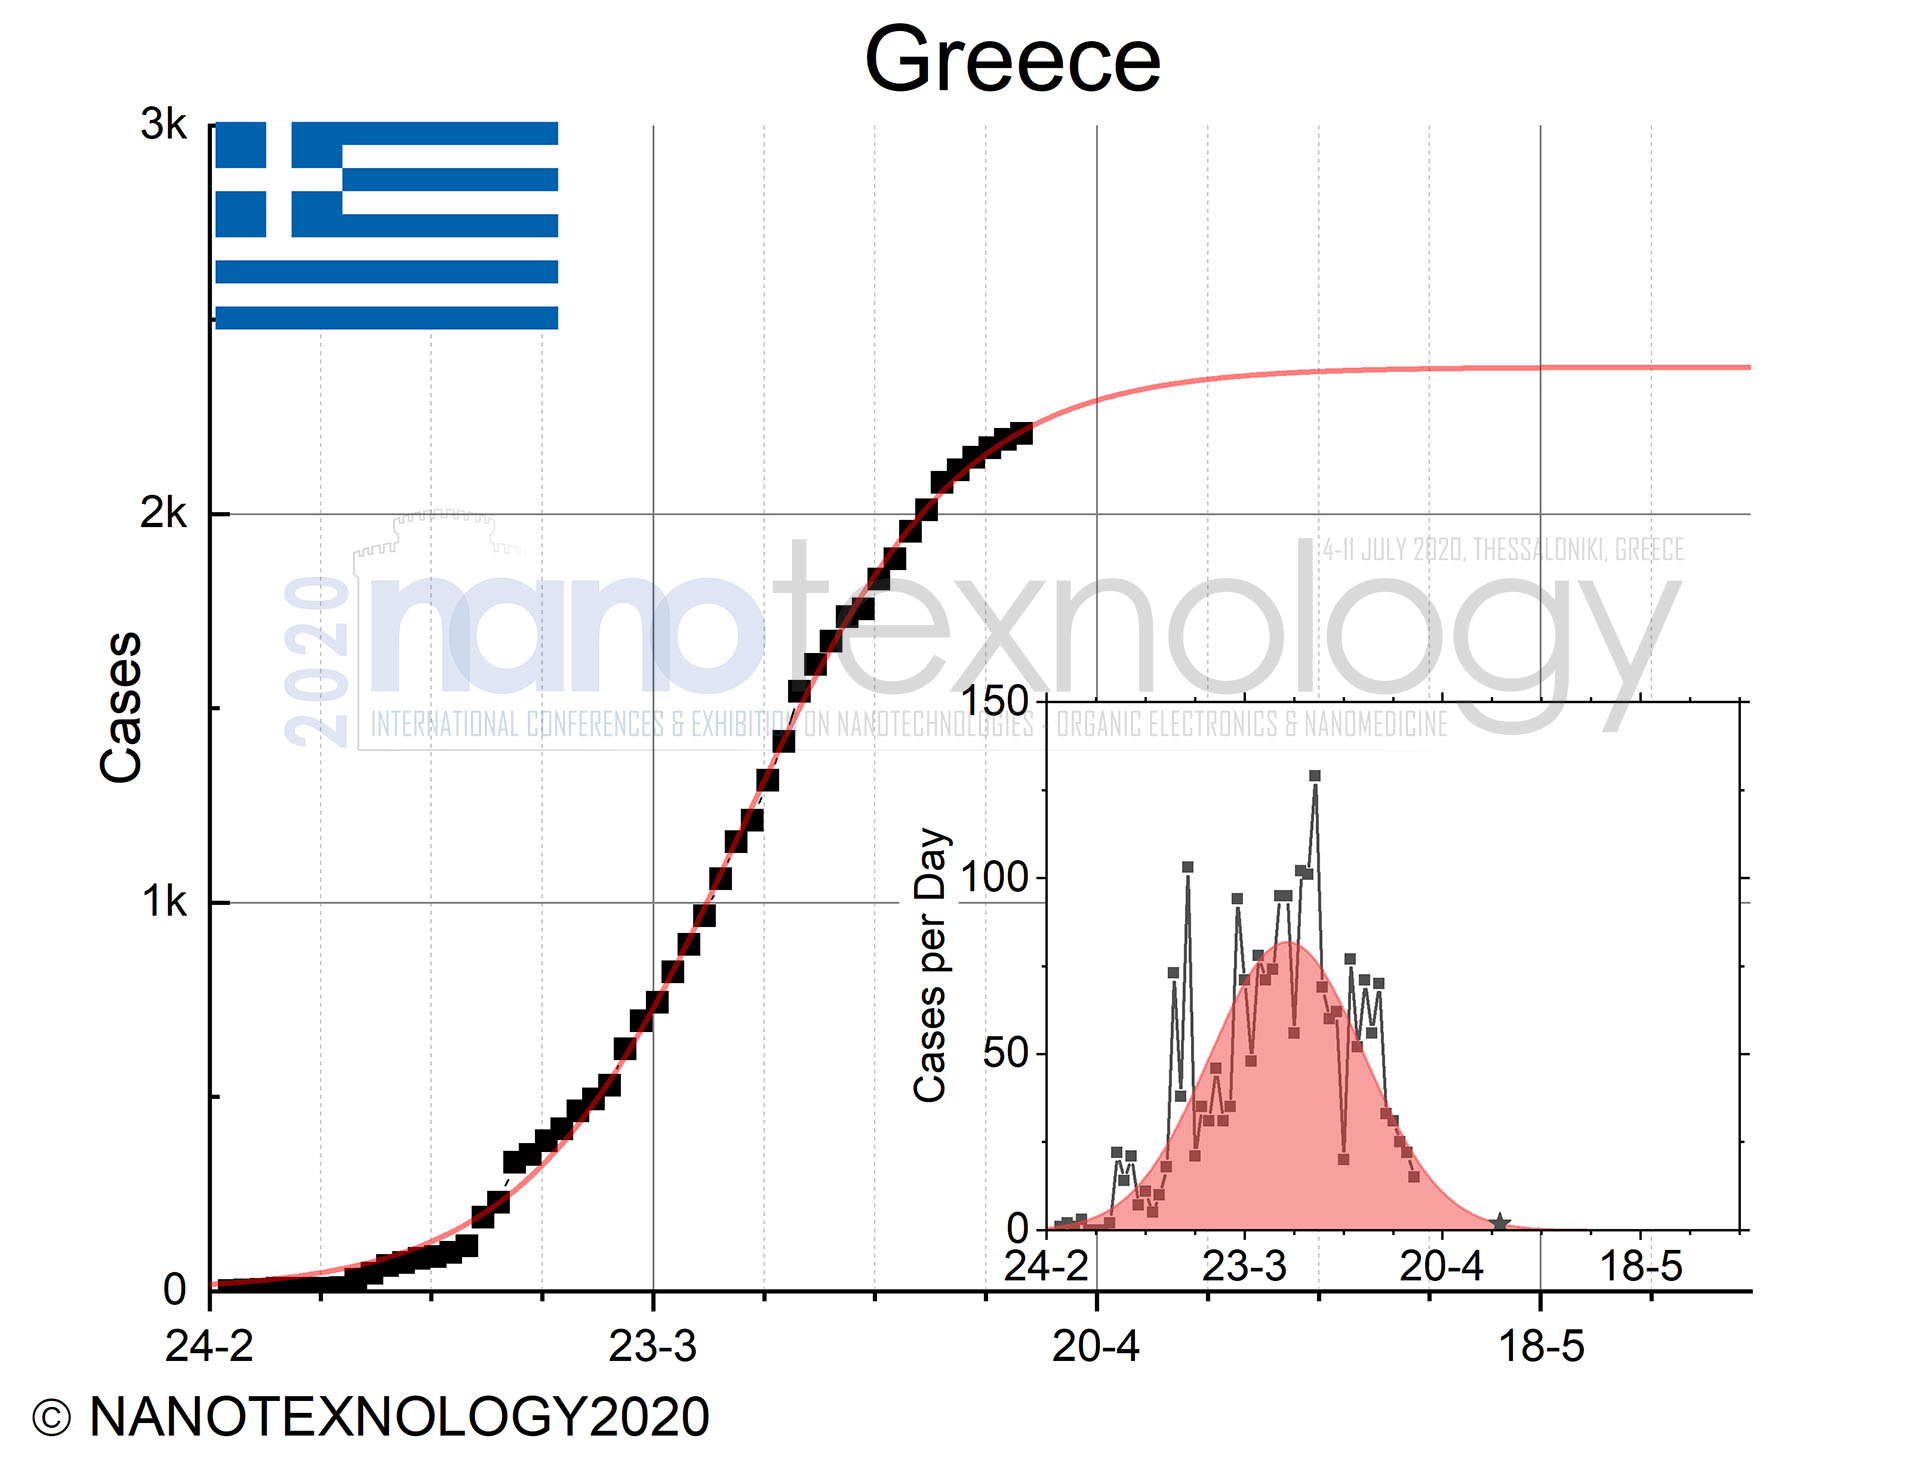
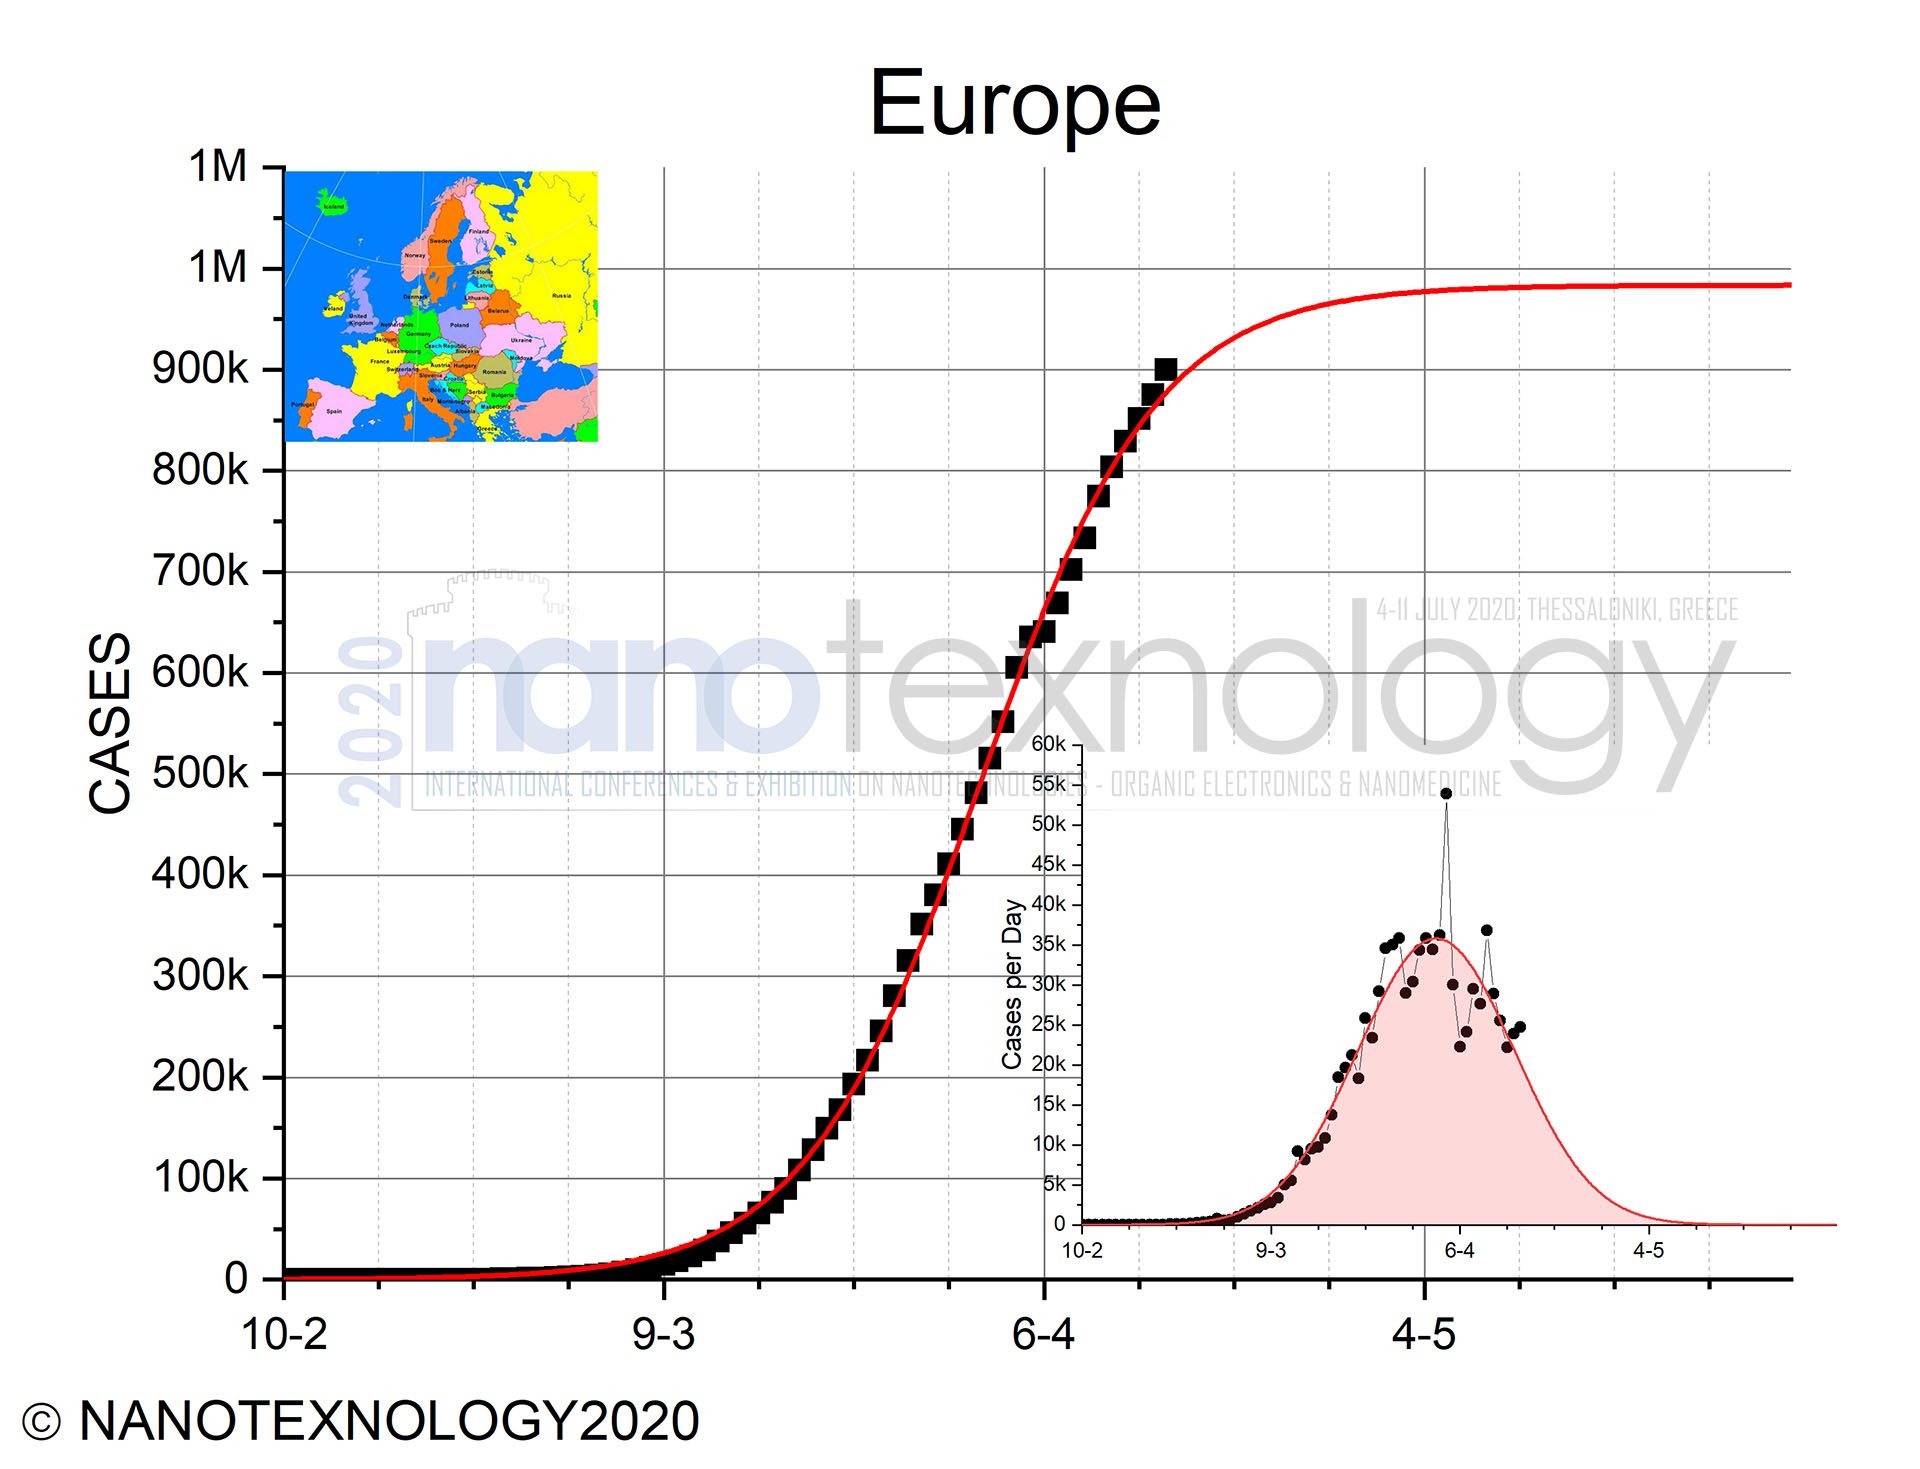
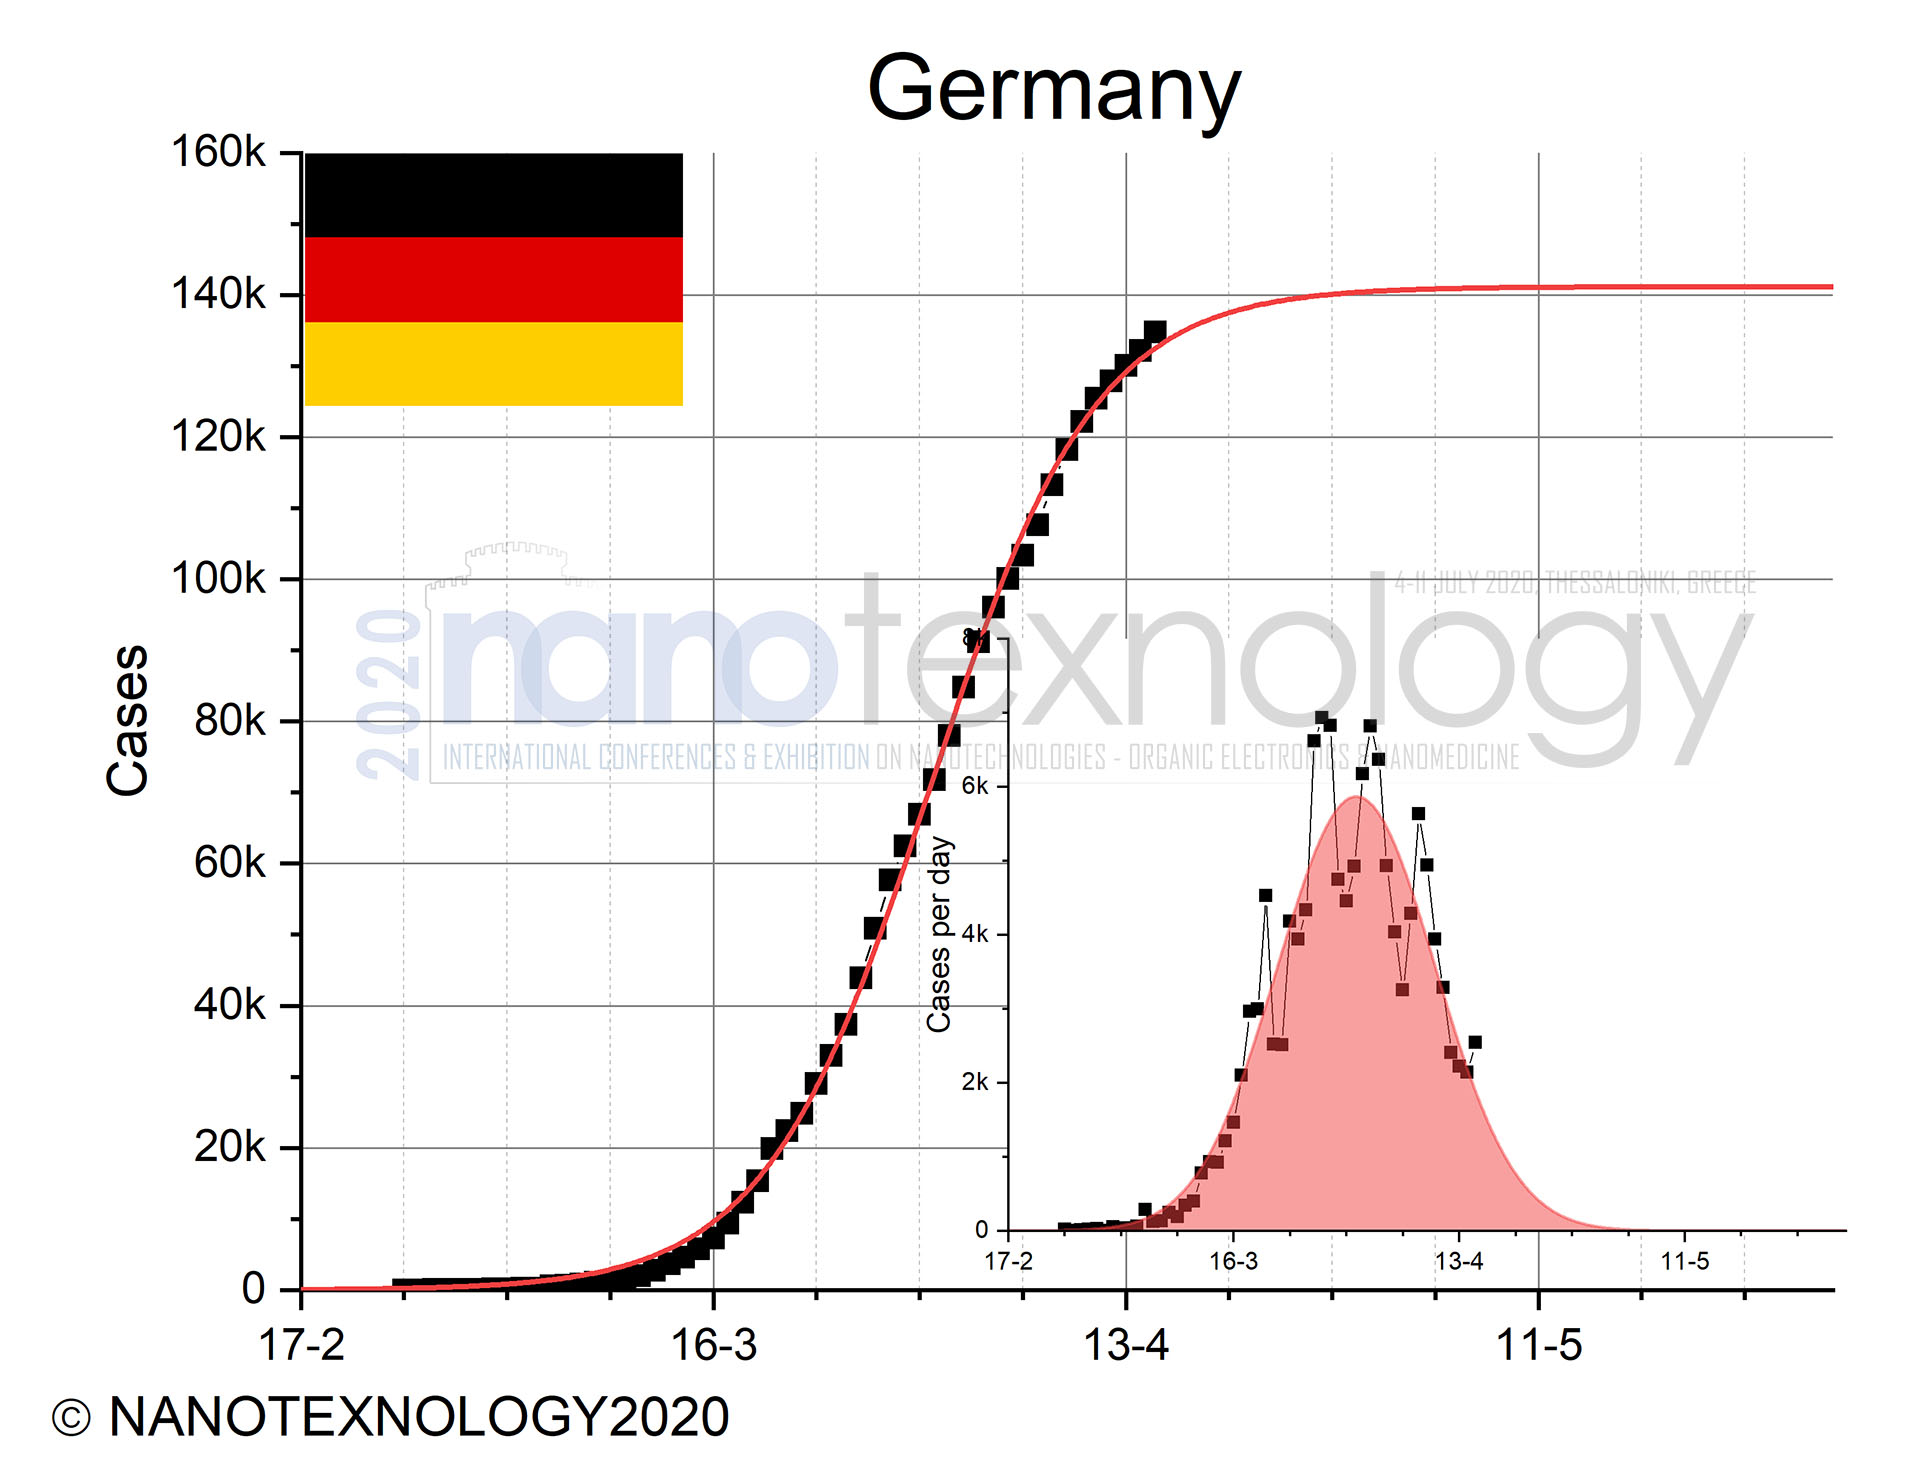
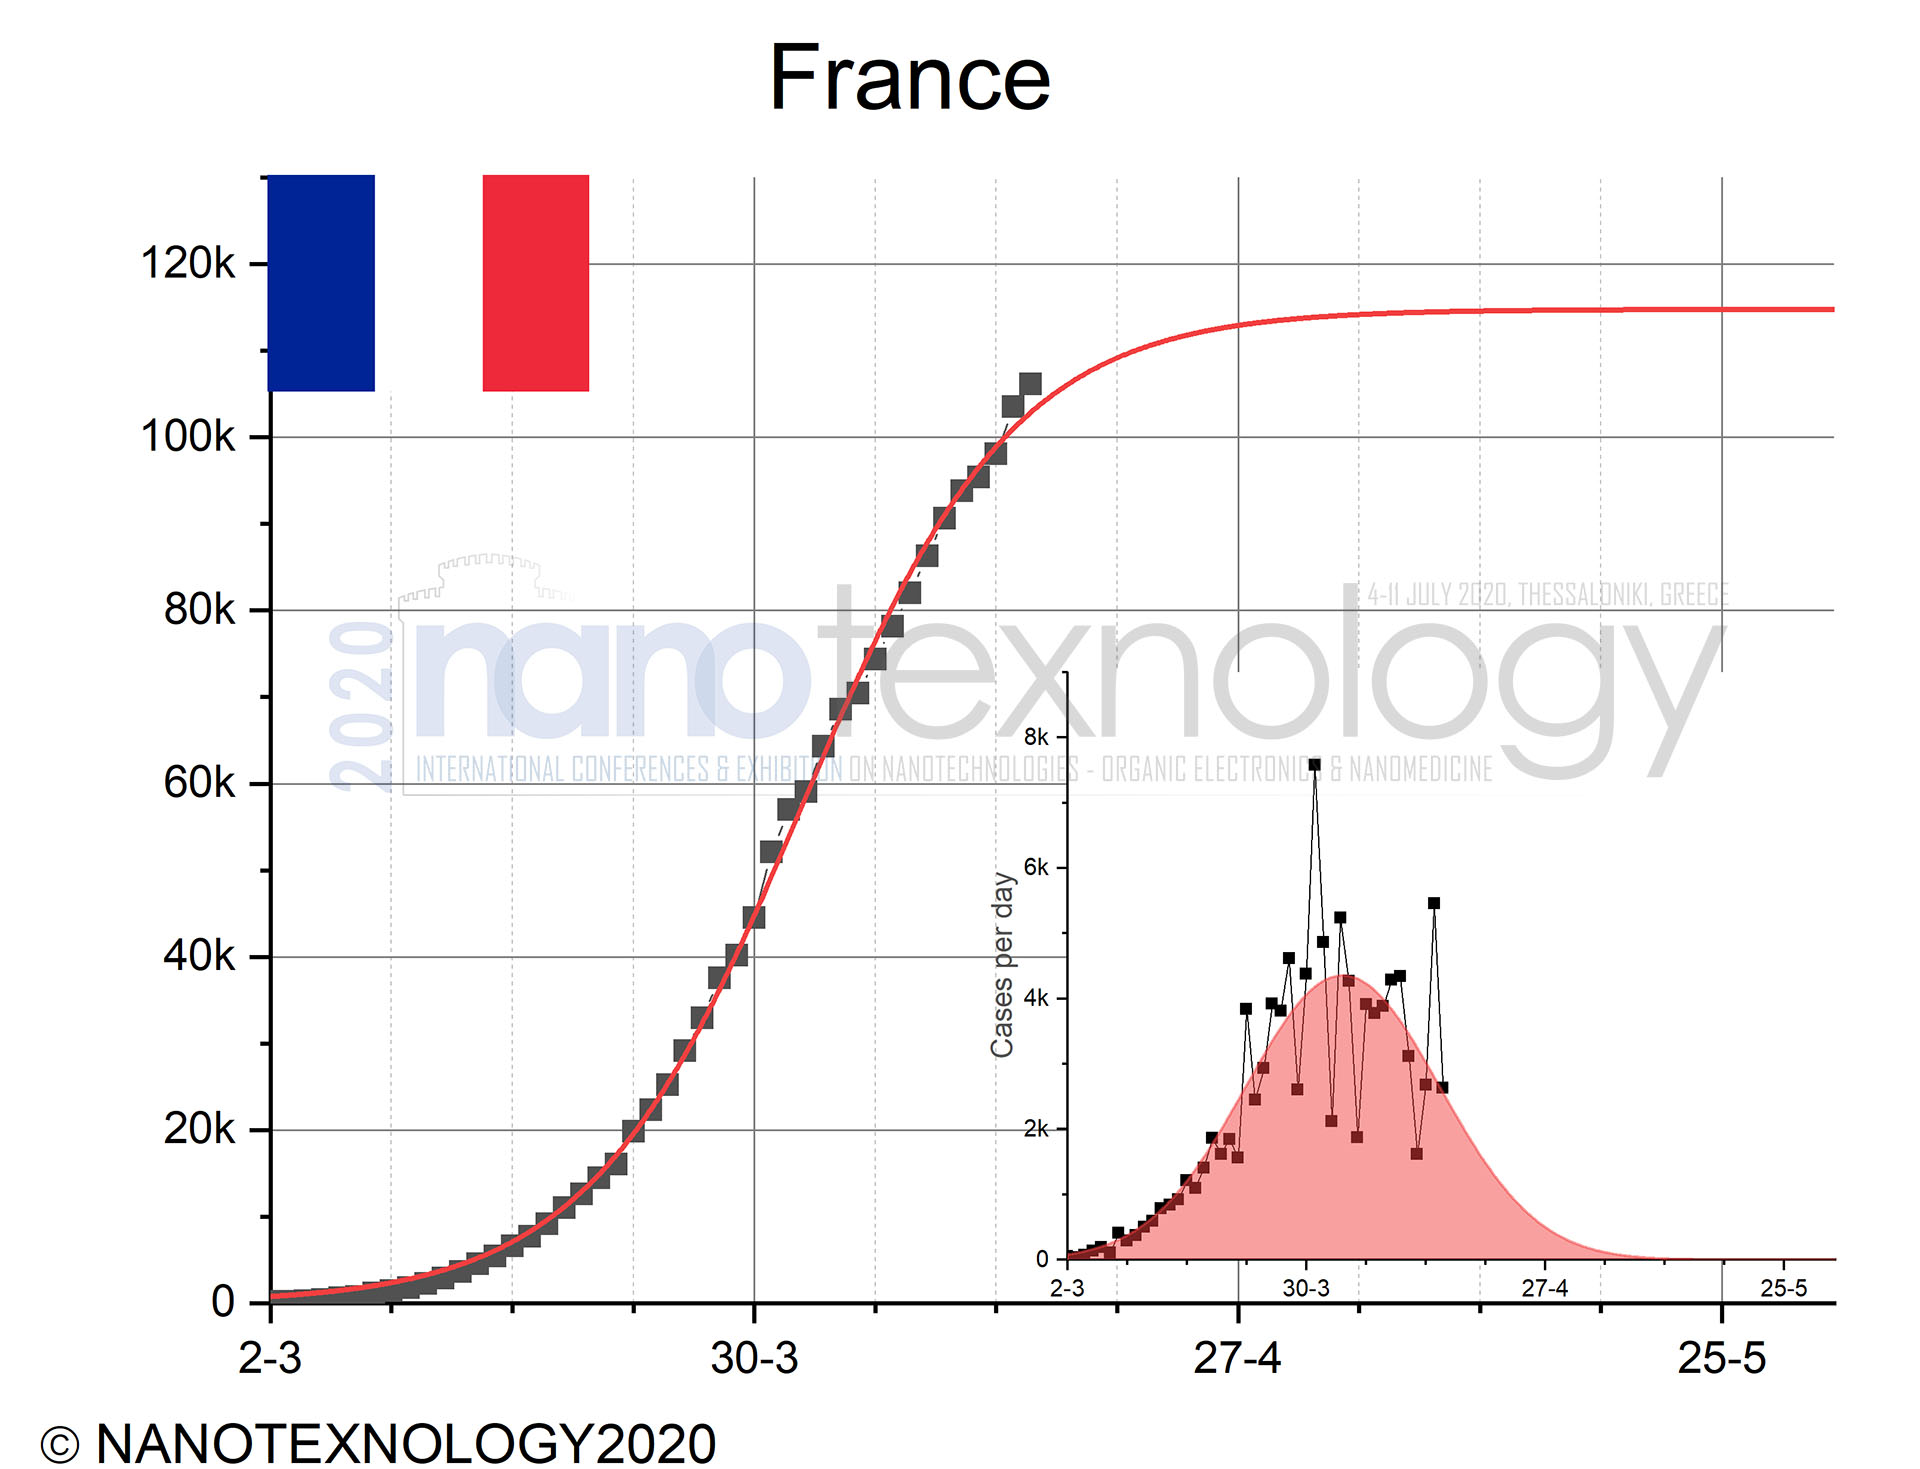
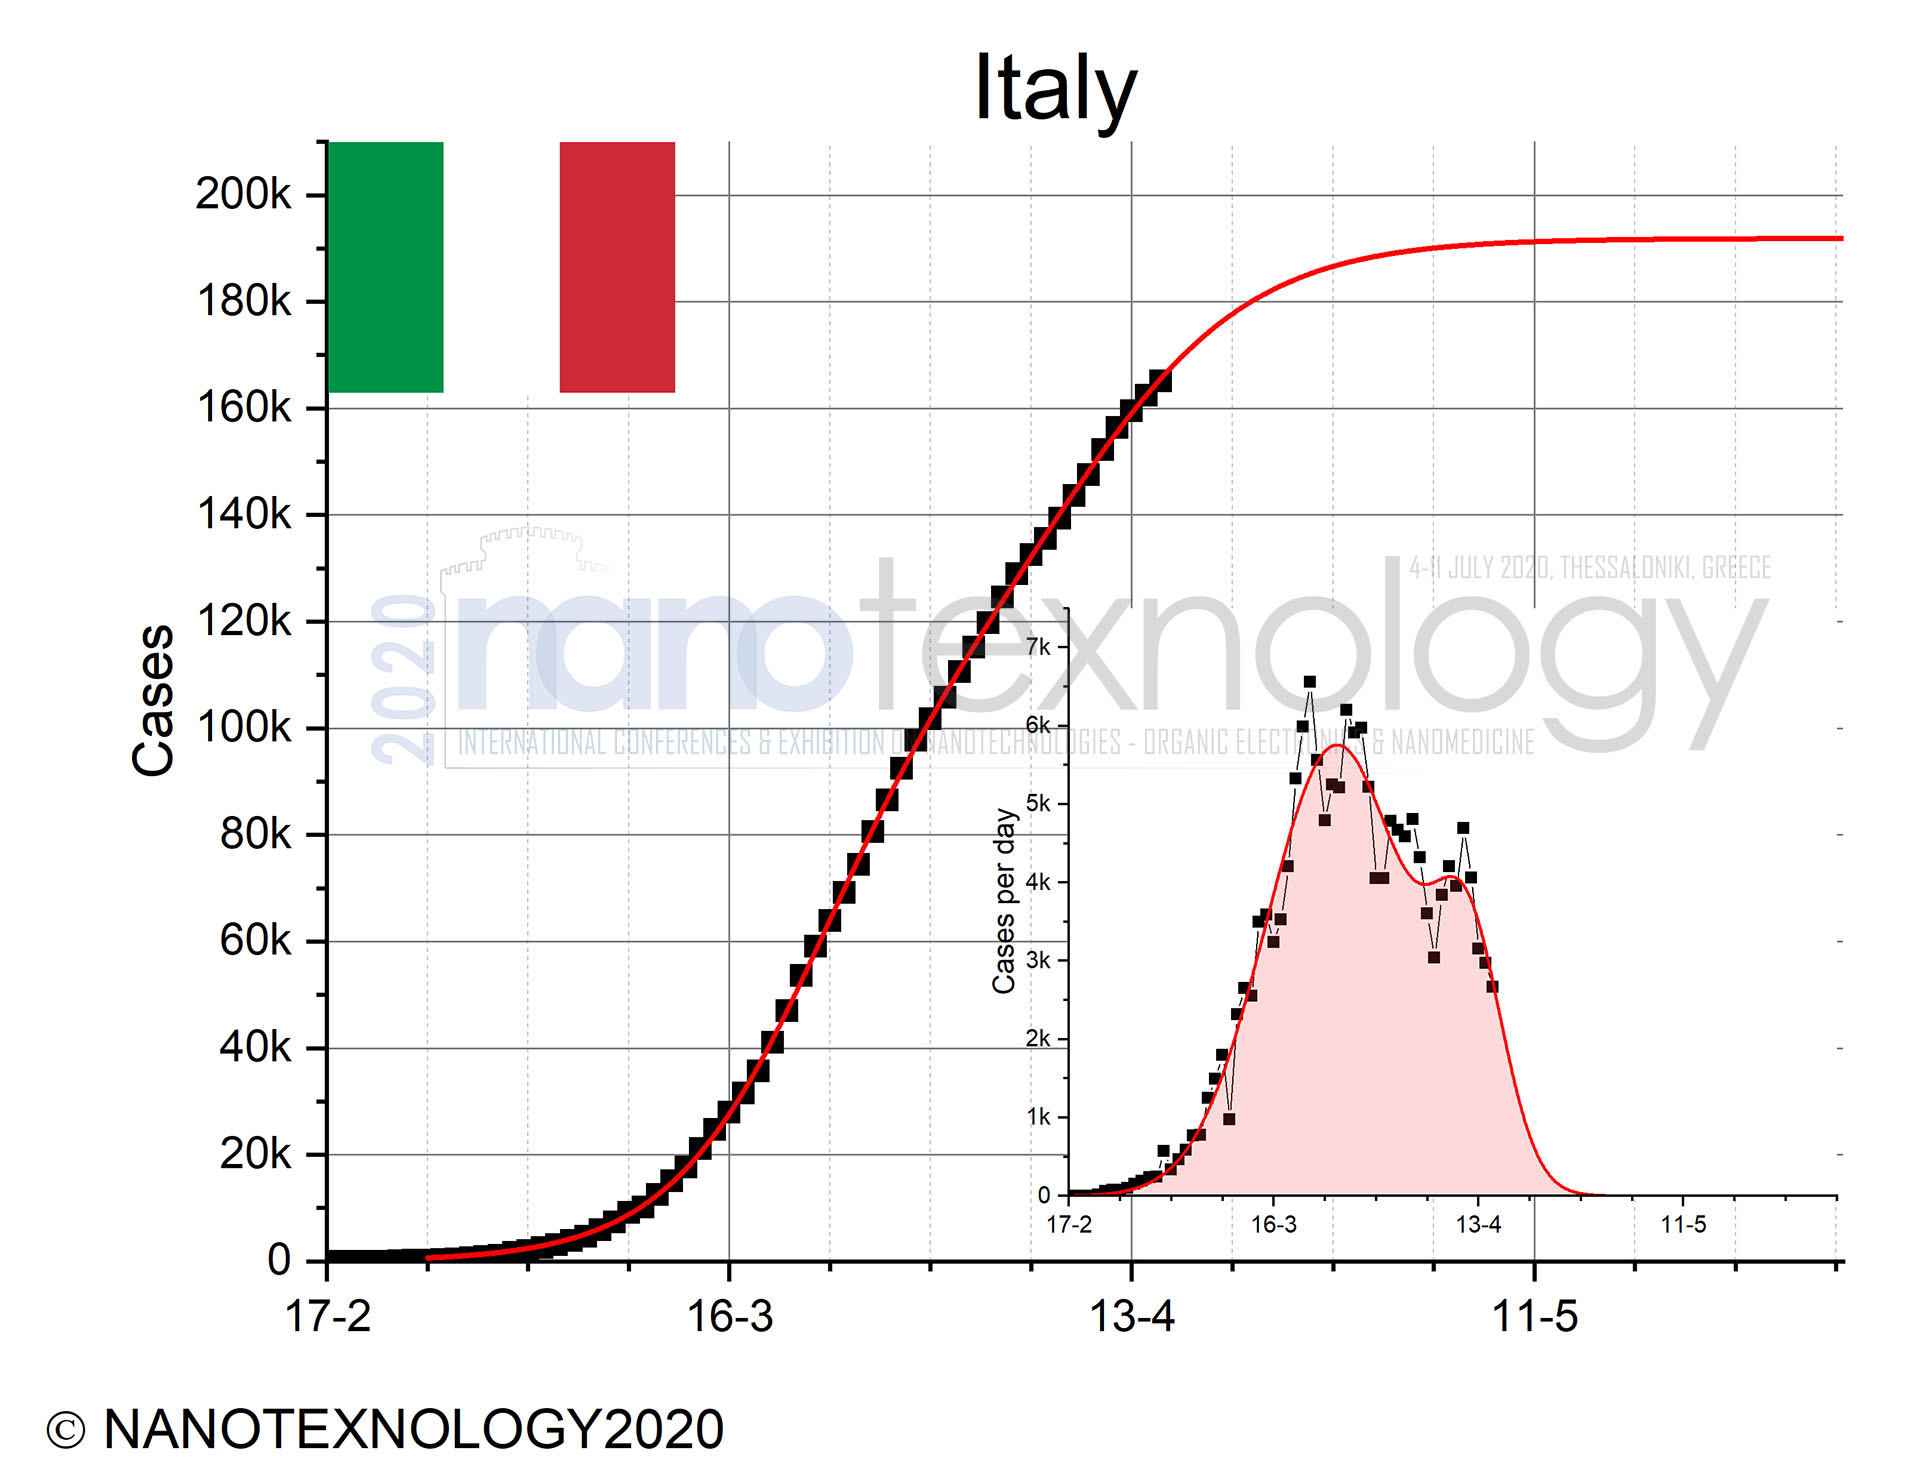
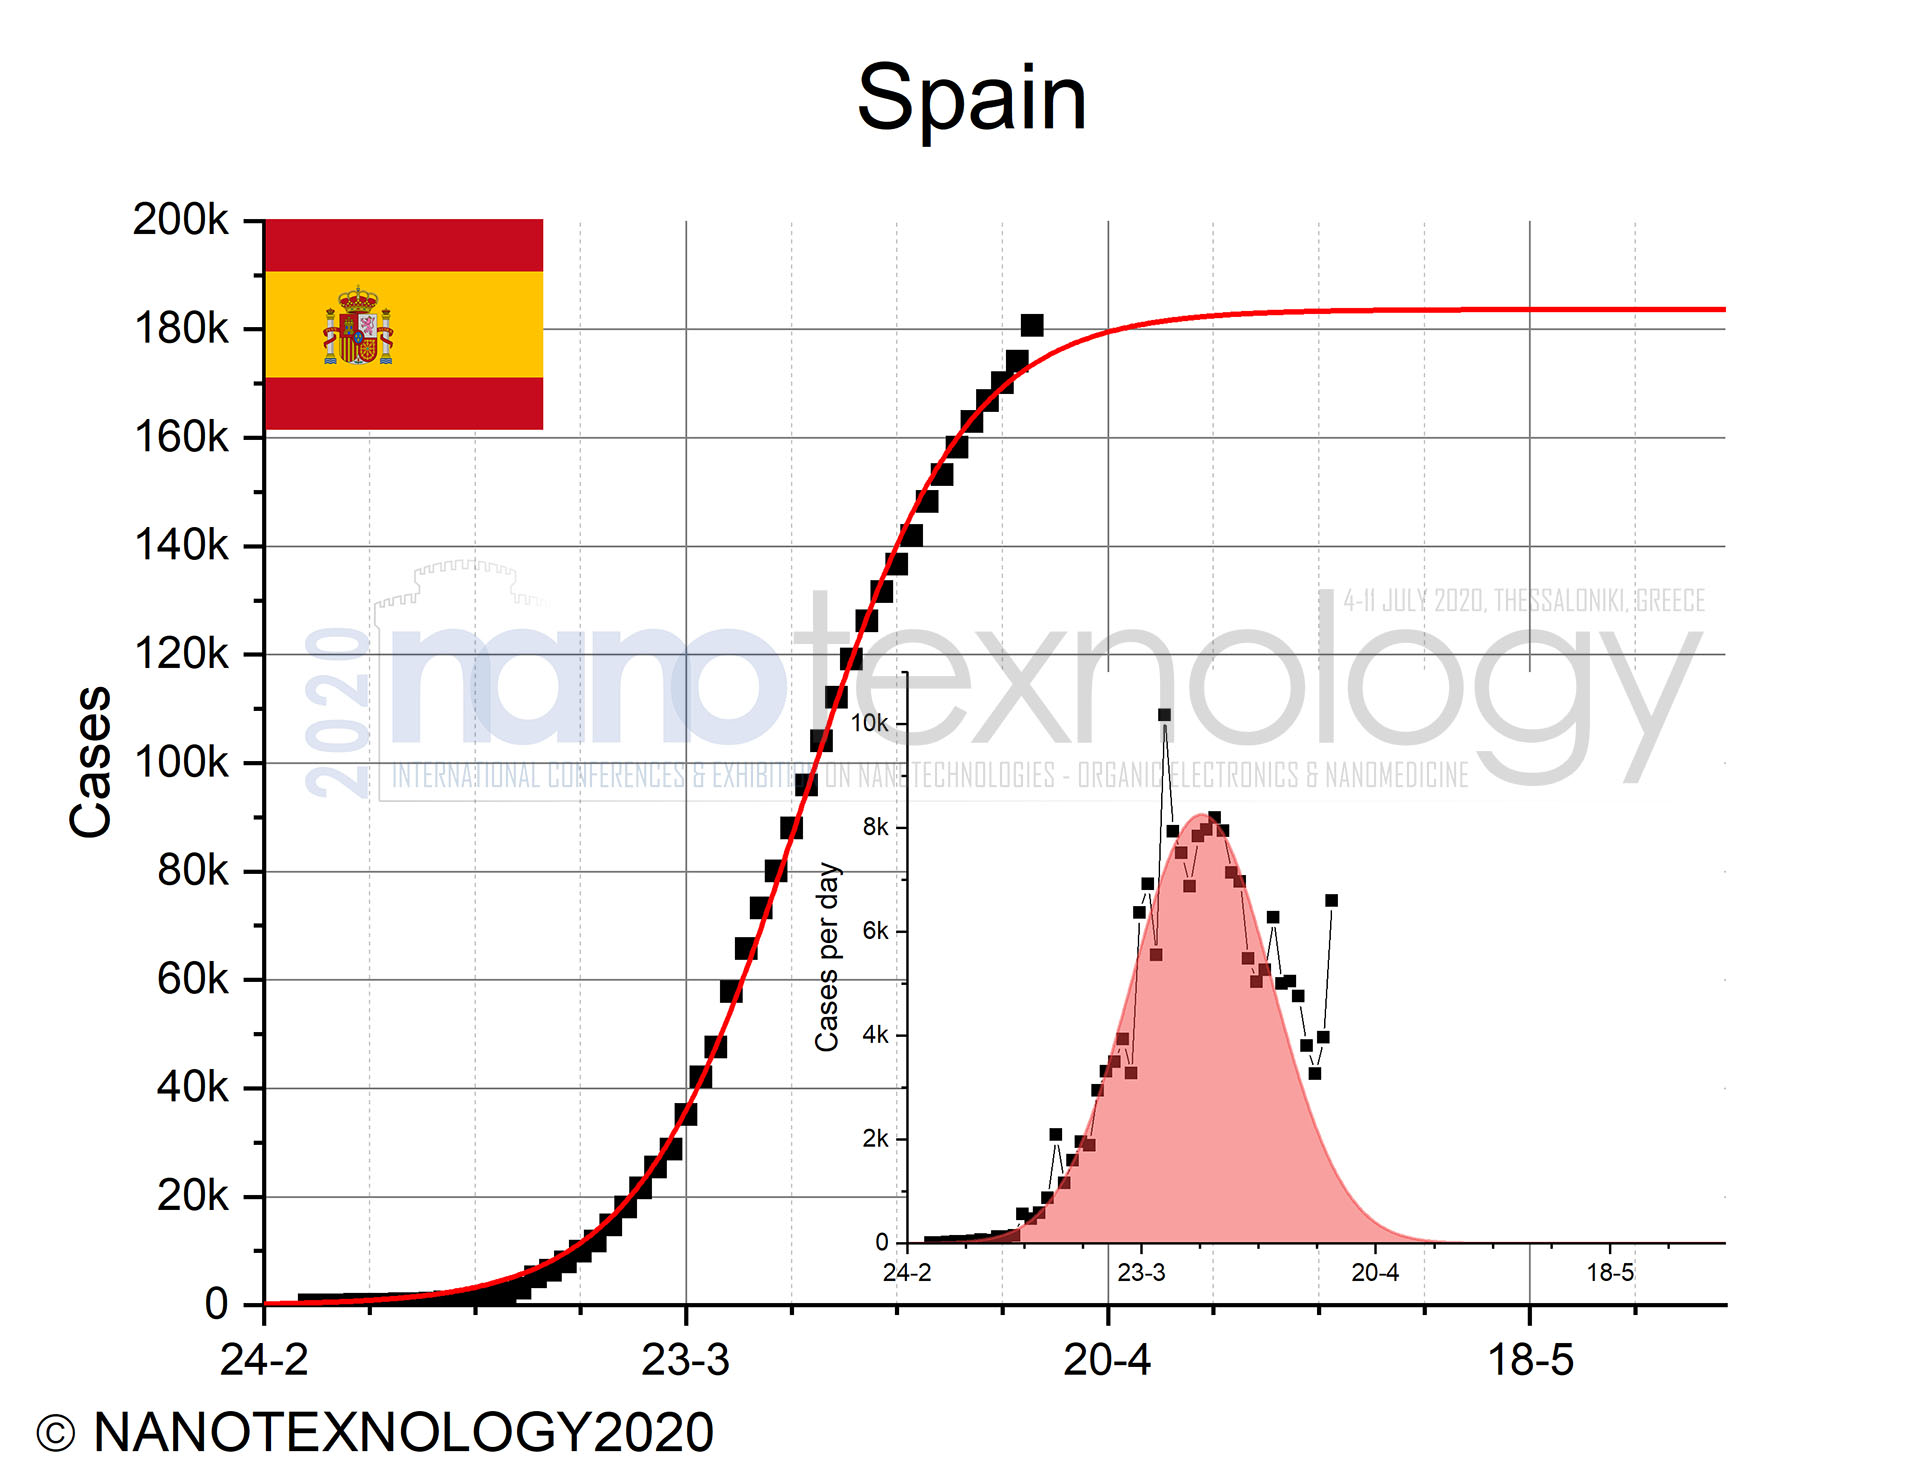
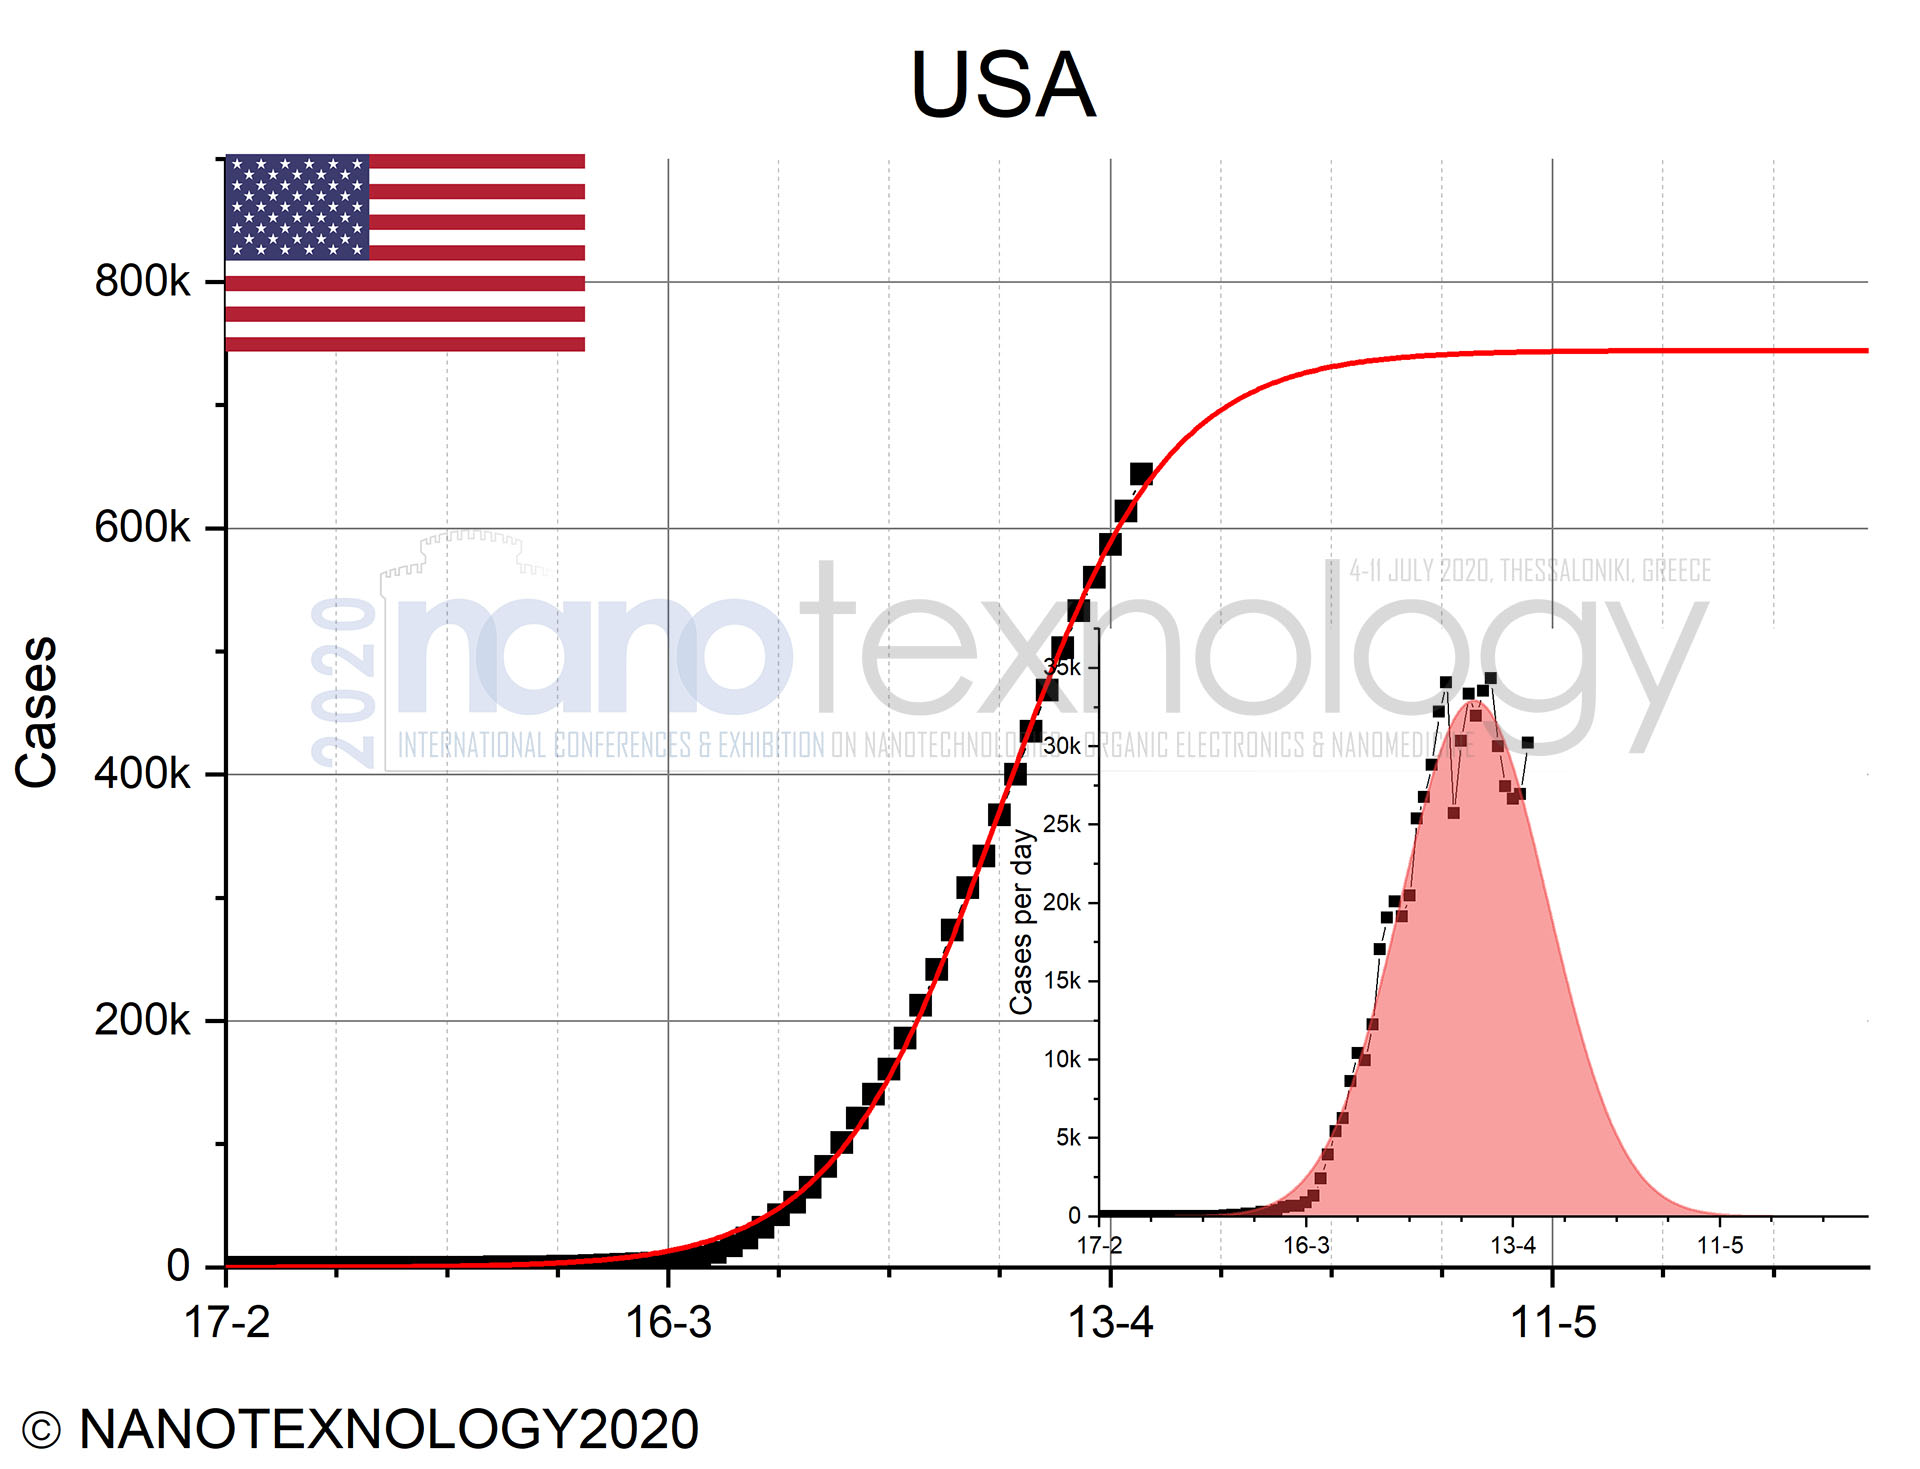
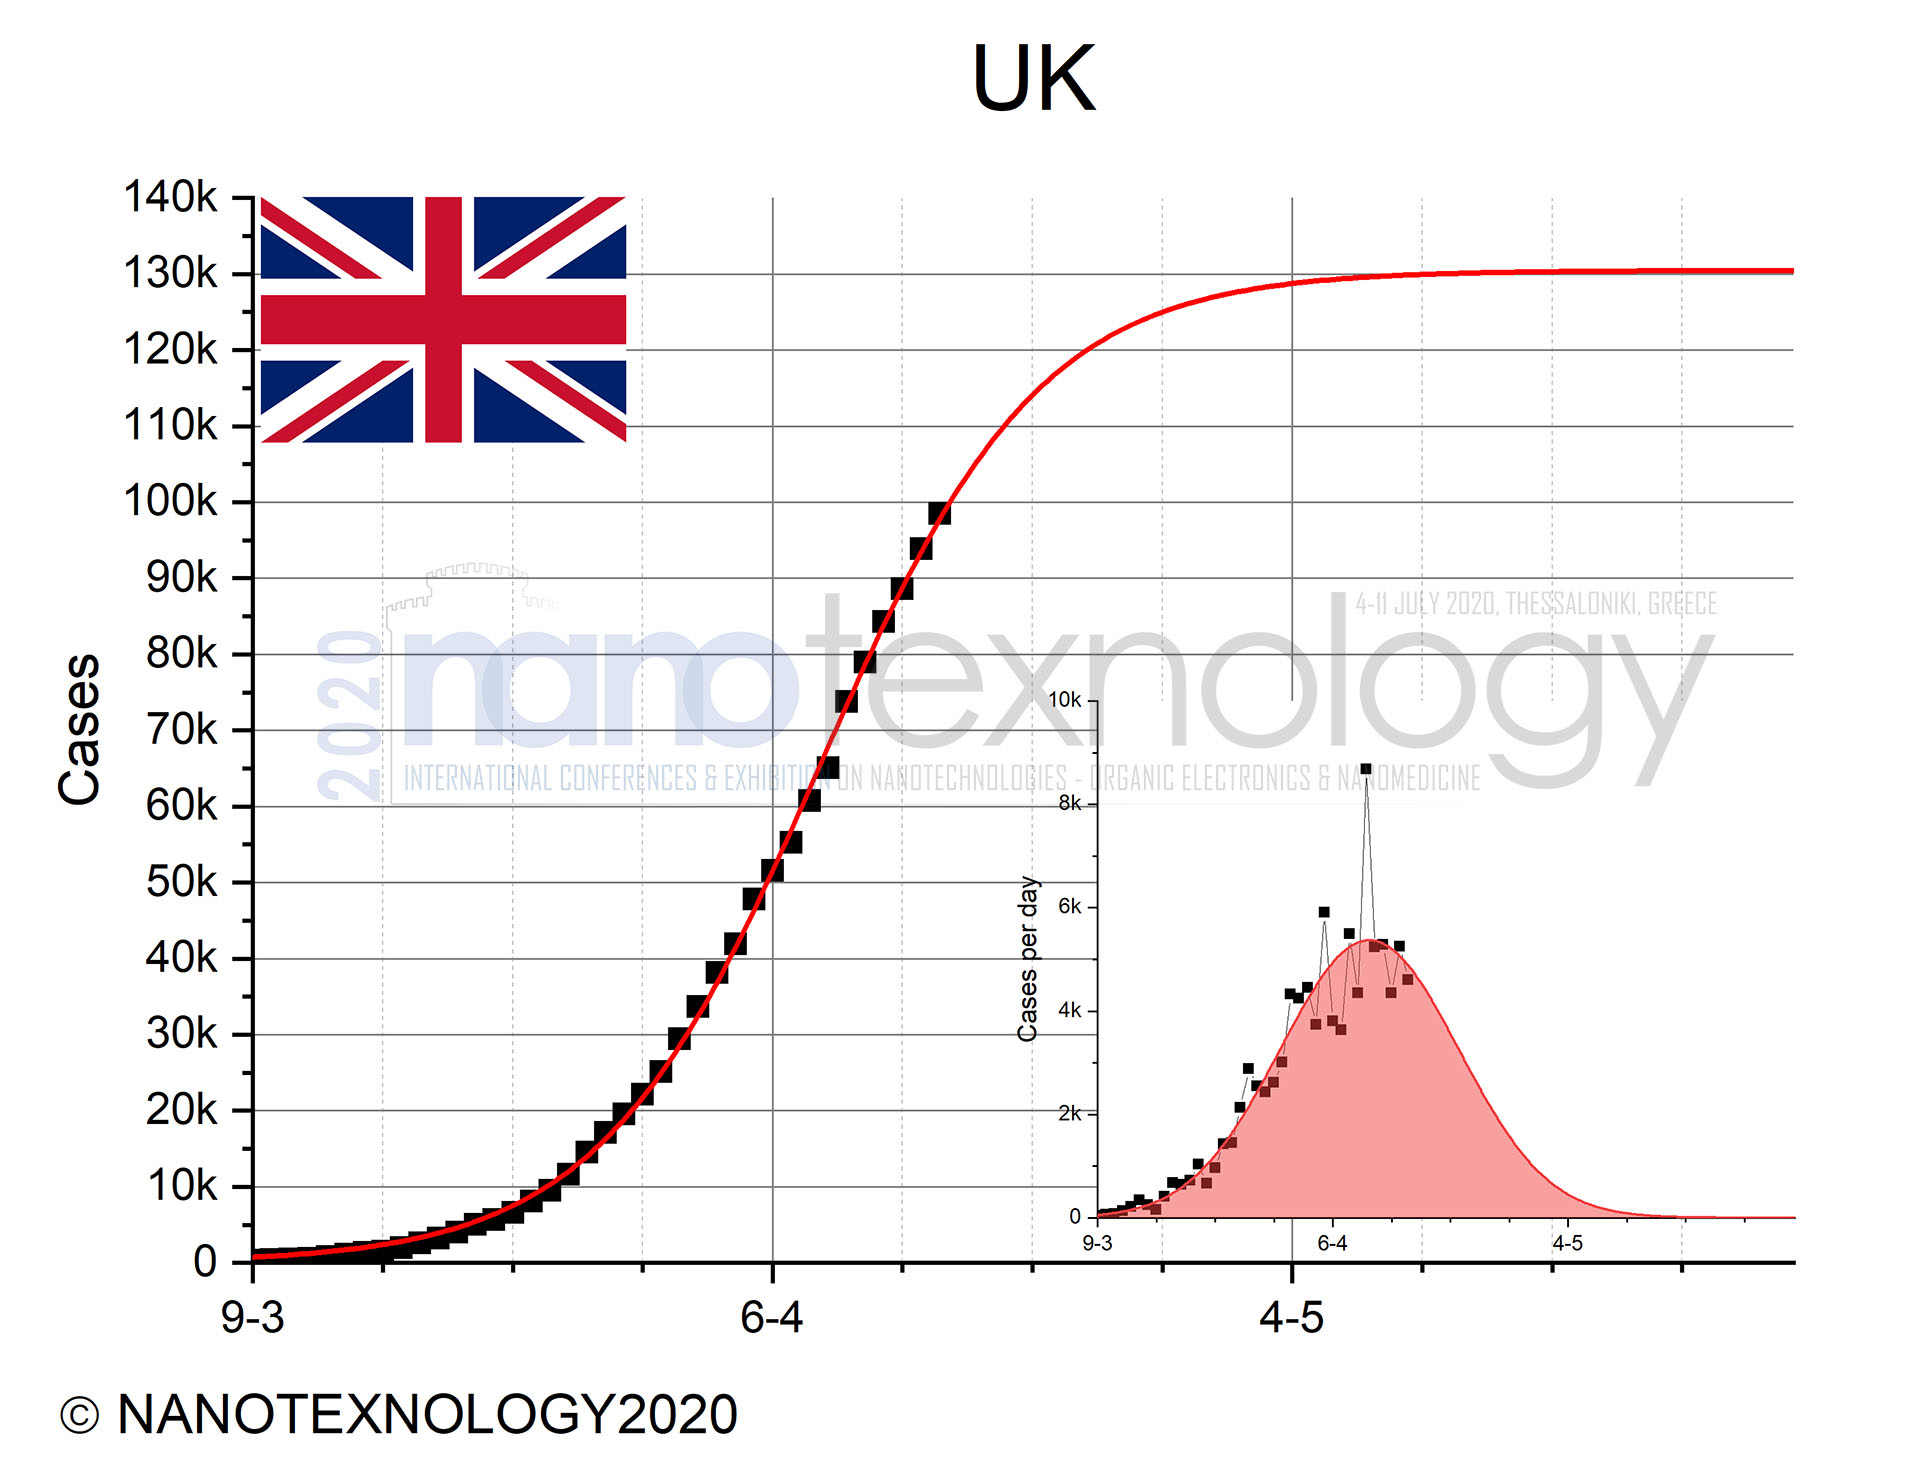
Based on studies and estimations of the situation on the confirmed cases, we present the current data (updated daily) and the predictions until end of June based on well documented S-curve and Gaussian modeling procedures on cumulative and daily data responsibly, confirmed cases data for many countries and geographical areas such as Greece, Europe, Germany, Italy, Spain, France, USA and Worldwide.
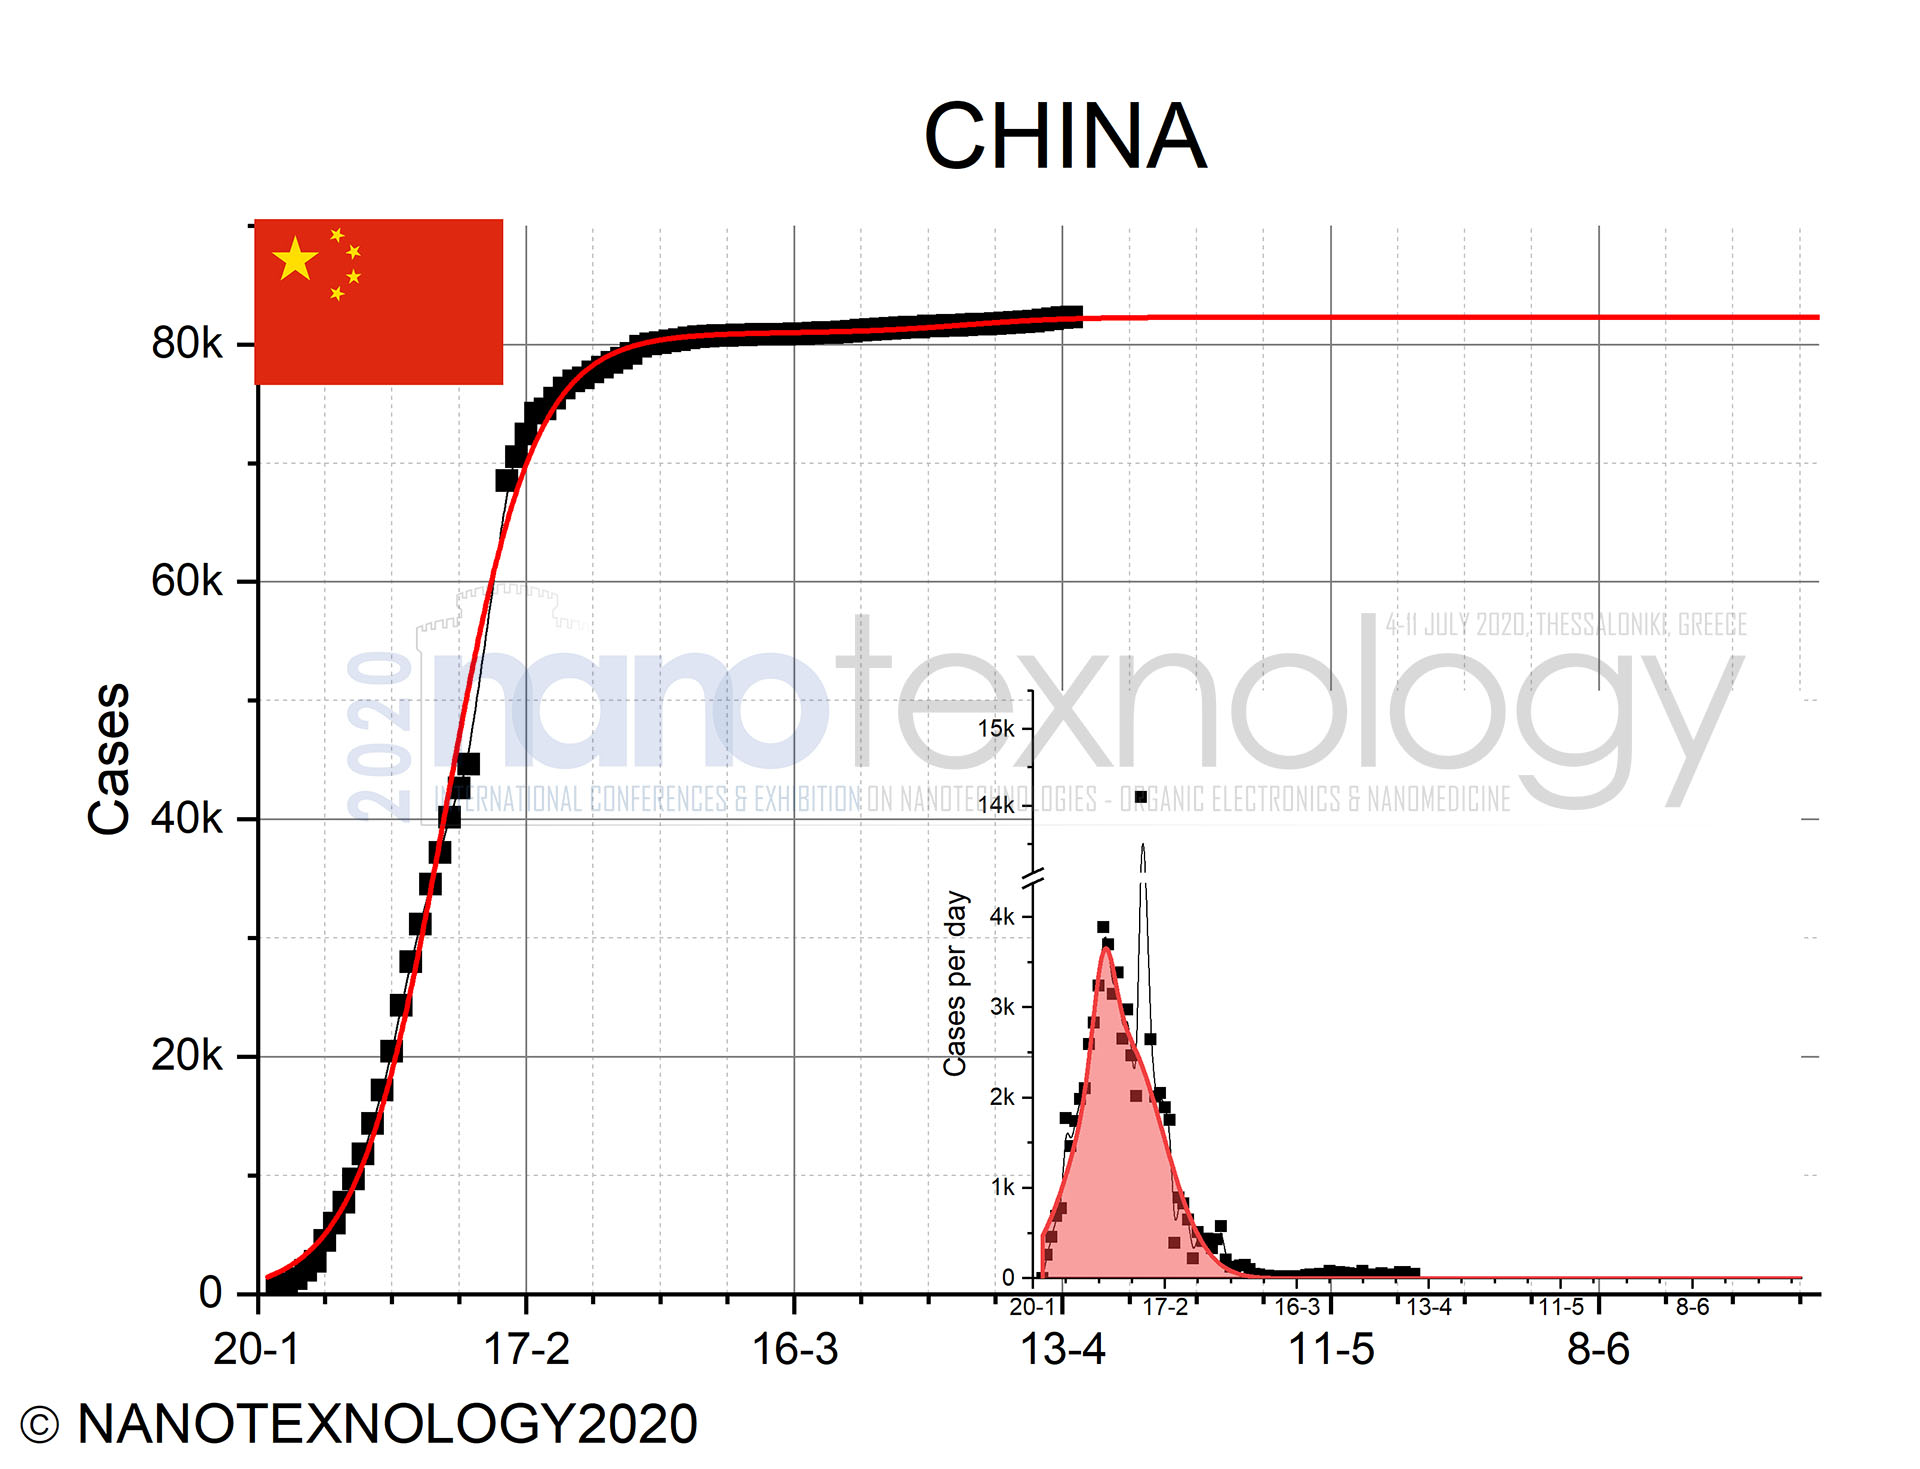
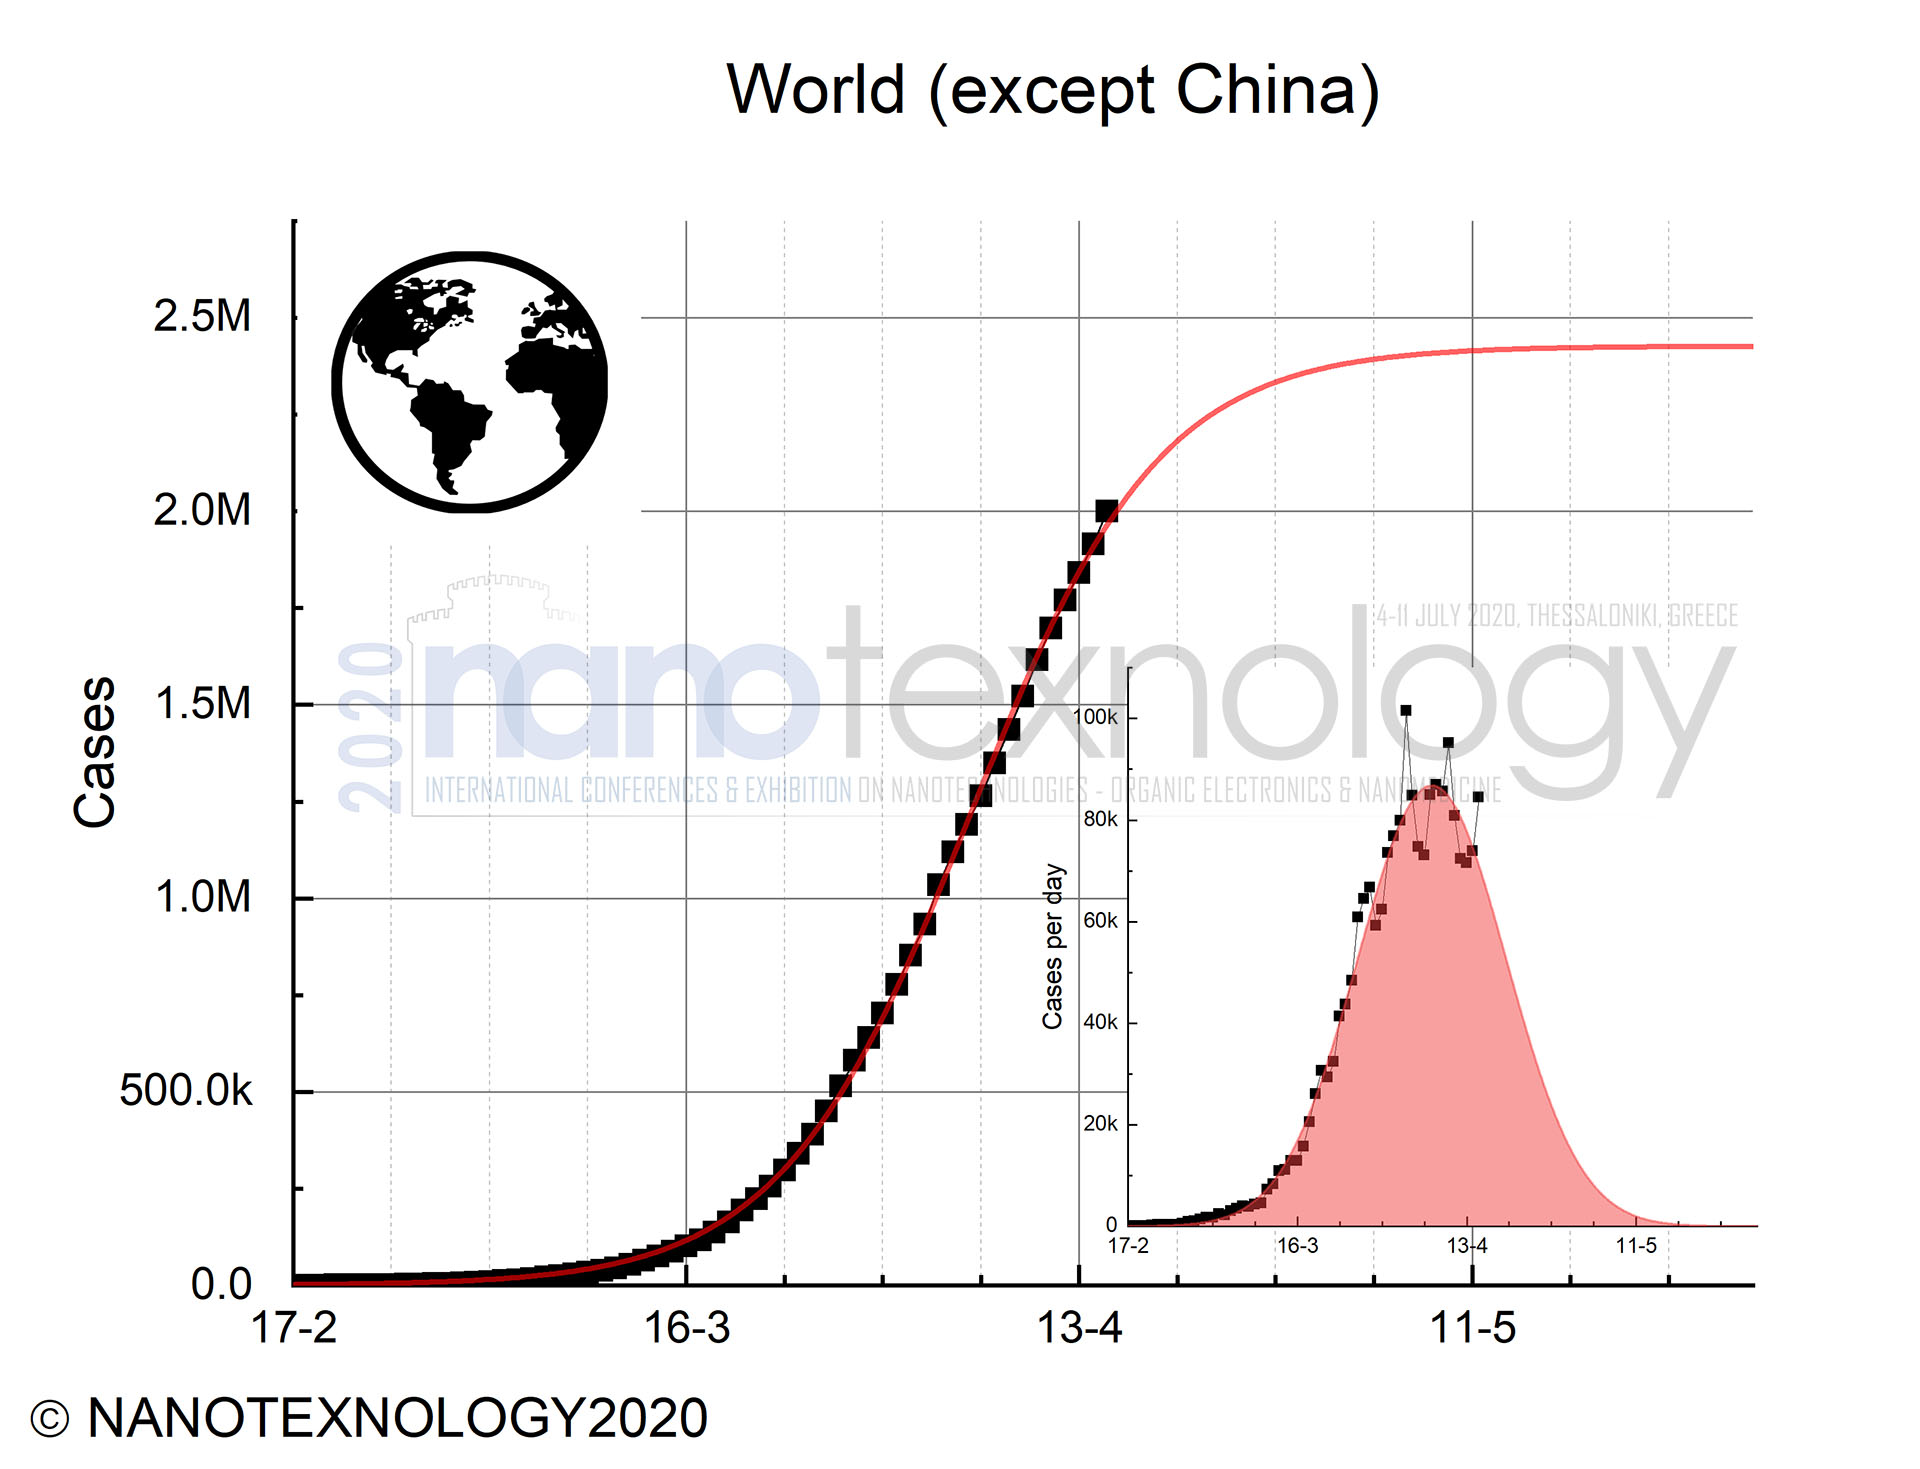
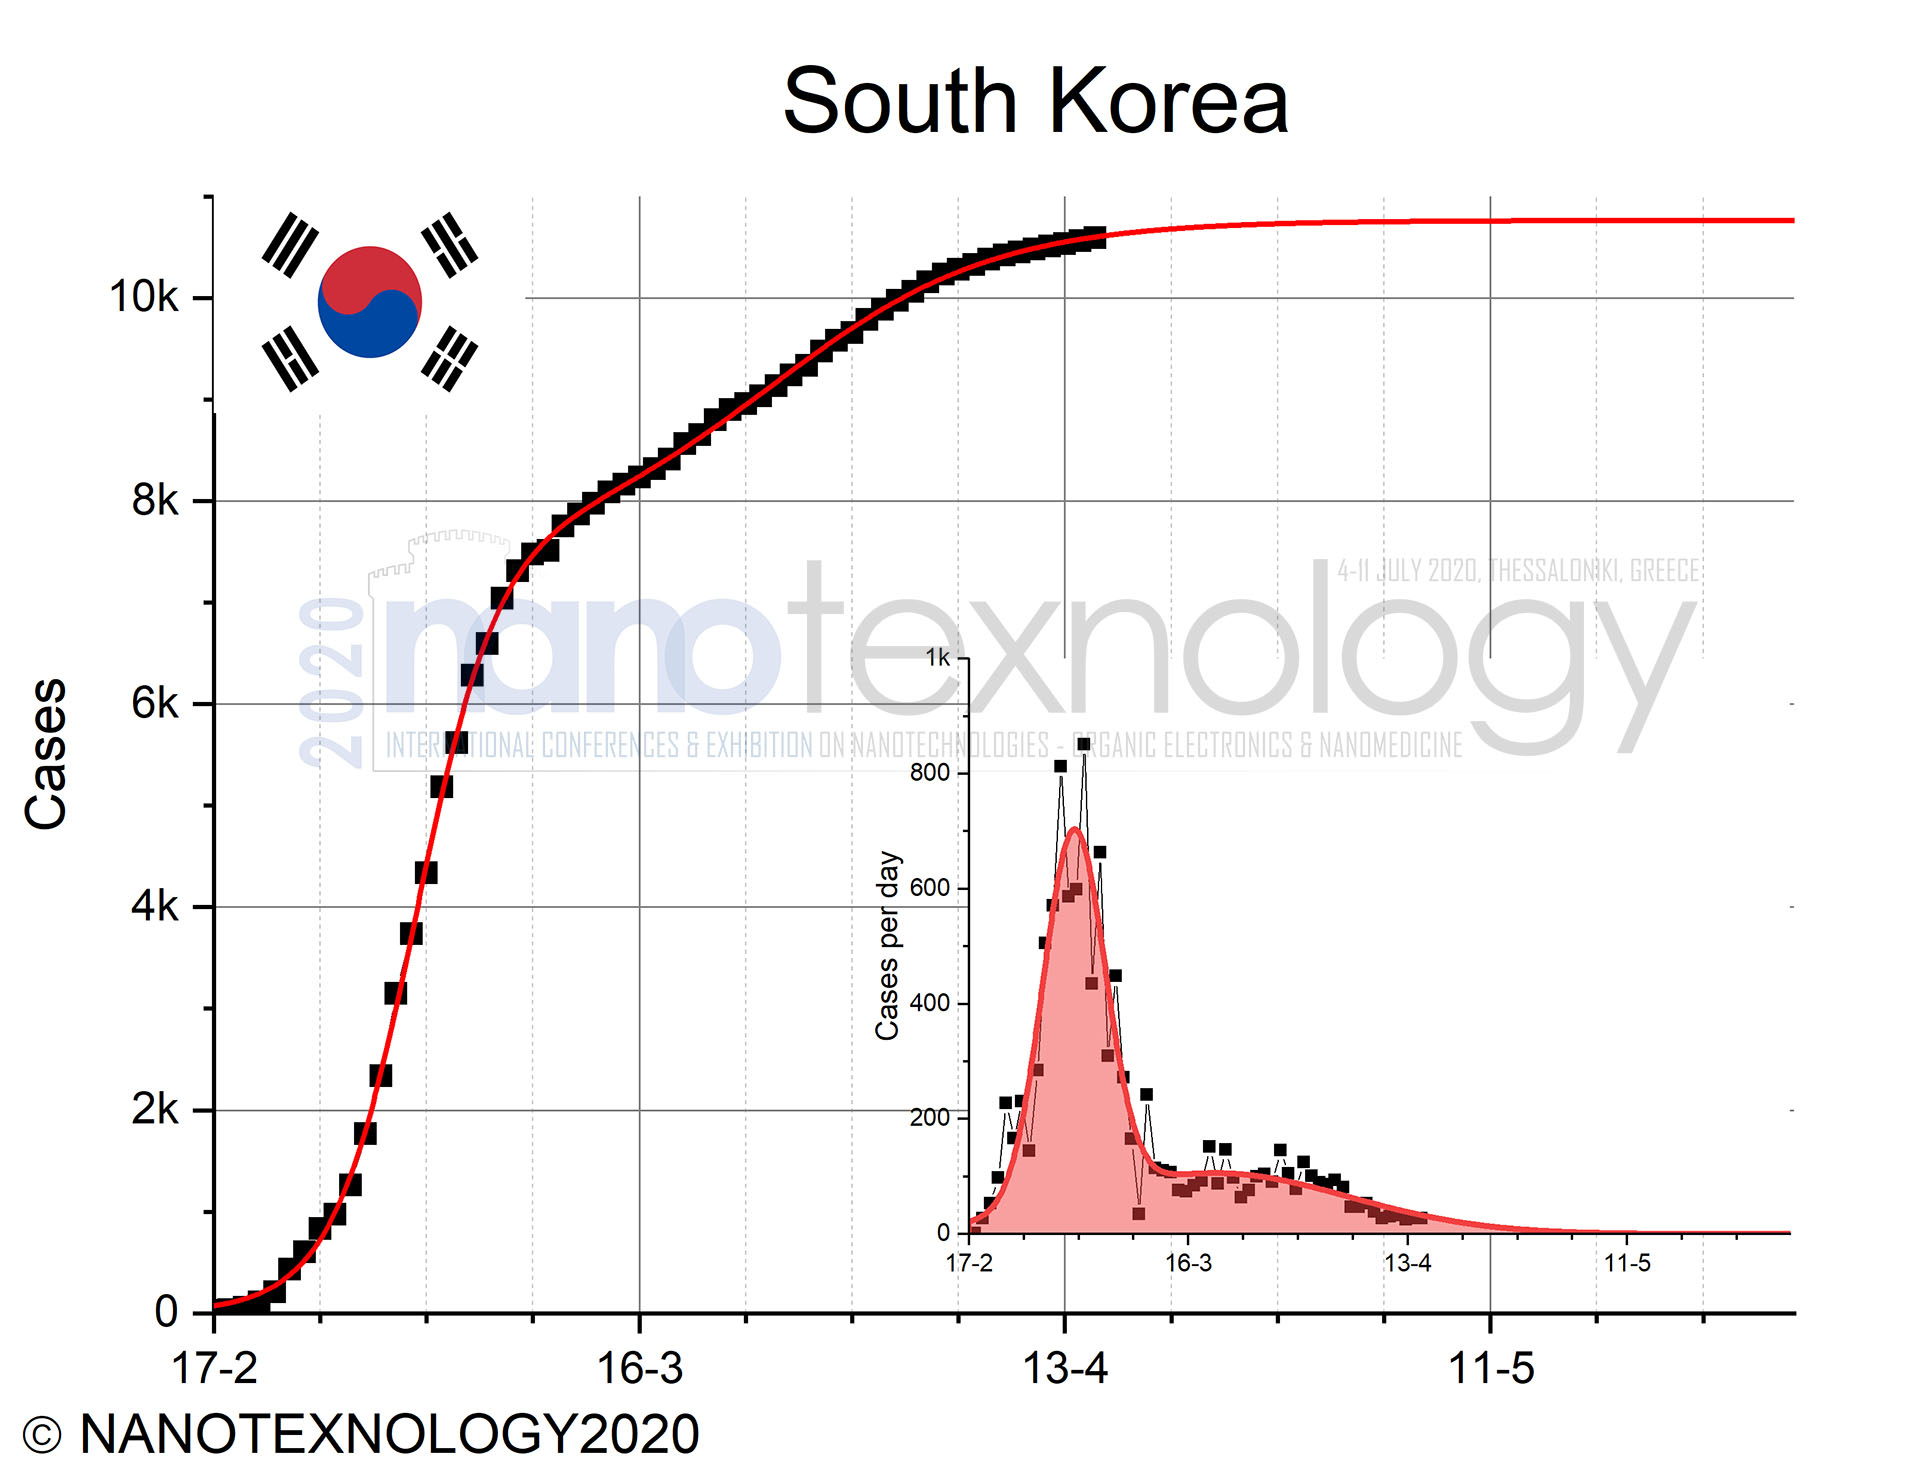
According to these estimations with the provided data to-date, the number of new cases has shown signs of a reduction, for example in Europe which is expected to reach a quite low number at the beginning of May, reaching a minimum number of new cases at the middle of May. This observation is based on the analysis of the total cases for each country with the S-curve and Gaussian models. Figures are shown the S-curves fitting results (solid lines) while in the insets are the corresponding derivatives, describing the evolution of total cases and the cases-per-day, respectively.
It has to be highlighted that any measures for lifting parts of the lockdown, will have a profound effect on the appearance of new cases, since as it widely known, this virus shows a tremendous spread potential. Therefore, any plans for a partial lift of the lockdown or other measures have been taken has to be performed with extreme care and consideration, and in accordance with a specific strategy and plan.
We would like to have your feedback and opinion on this study and the estimations that will help all of us to deal with this unprecedented situation with calmness and professionalism, and to help all of our colleagues, collaborators, students, family, friends and fellow citizens, both in the next door and across the globe.
On behalf of the NANOTEXNOLOGY Organizing Committee,
 |
 |
|
 |
 |
|
 |
 |
|
 |
 |
|
 |
 |
|
 |
||
Figures. Calculated (solid lines) evolution of the total number of COVID-19 cases (solid points) for each country and globally, based on the analysis with the S-curve model. The inset figures show the evolution and the analysis of the reported cases-per-day using the derivative of the S-curve equation.