![]()
Studies and Predictions on COVID-19 pandemic status Worldwide
Within these difficult and challenging circumstances brought by the COVID-19 pandemic, we are thinking on how to contribute as scientists and responsible citizens, and how we can help our people and our society.
Since the outbreak of this pandemic, the NANOTEXNOLOGY Organizing Committee and the Nanotechnology Lab LTFN at AUTh, are constantly monitoring and study the situation worldwide. We follow daily the published reports and statistics, and the measures implemented by the governments in order to limit the spread of the COVID-19 and to protect our health and on the other side to reduce the economic consequences.
We have described in our previous communications - found here (1) and here (2) - that based on well documented S-curve and Gaussian modeling procedures on cumulative and daily data responsibly we study and predict the COVID-19 evolution. Today these confirmed cases data and studies come from all geographical regions Europe, USA, S. America, Asia, Africa and Worldwide, and from many individual countries such as Germany, Italy, Spain, France, Greece, S. Korea, Brazil, Turkey, Israel and so on.
In our last communication we pointed out that any measure for lifting parts of the lockdown, or external cases not taken into account in the country plans will have a profound effect on the appearance of new infection cases, since this virus shows a tremendous spread potential. We also added there that any plans for a partial lift of the lockdown should be taken with extreme care and in accordance with a specific plan and based on a trial and error approach. Today we are observed the results of such plans which have be taken the last two weeks in various countries around the globe.
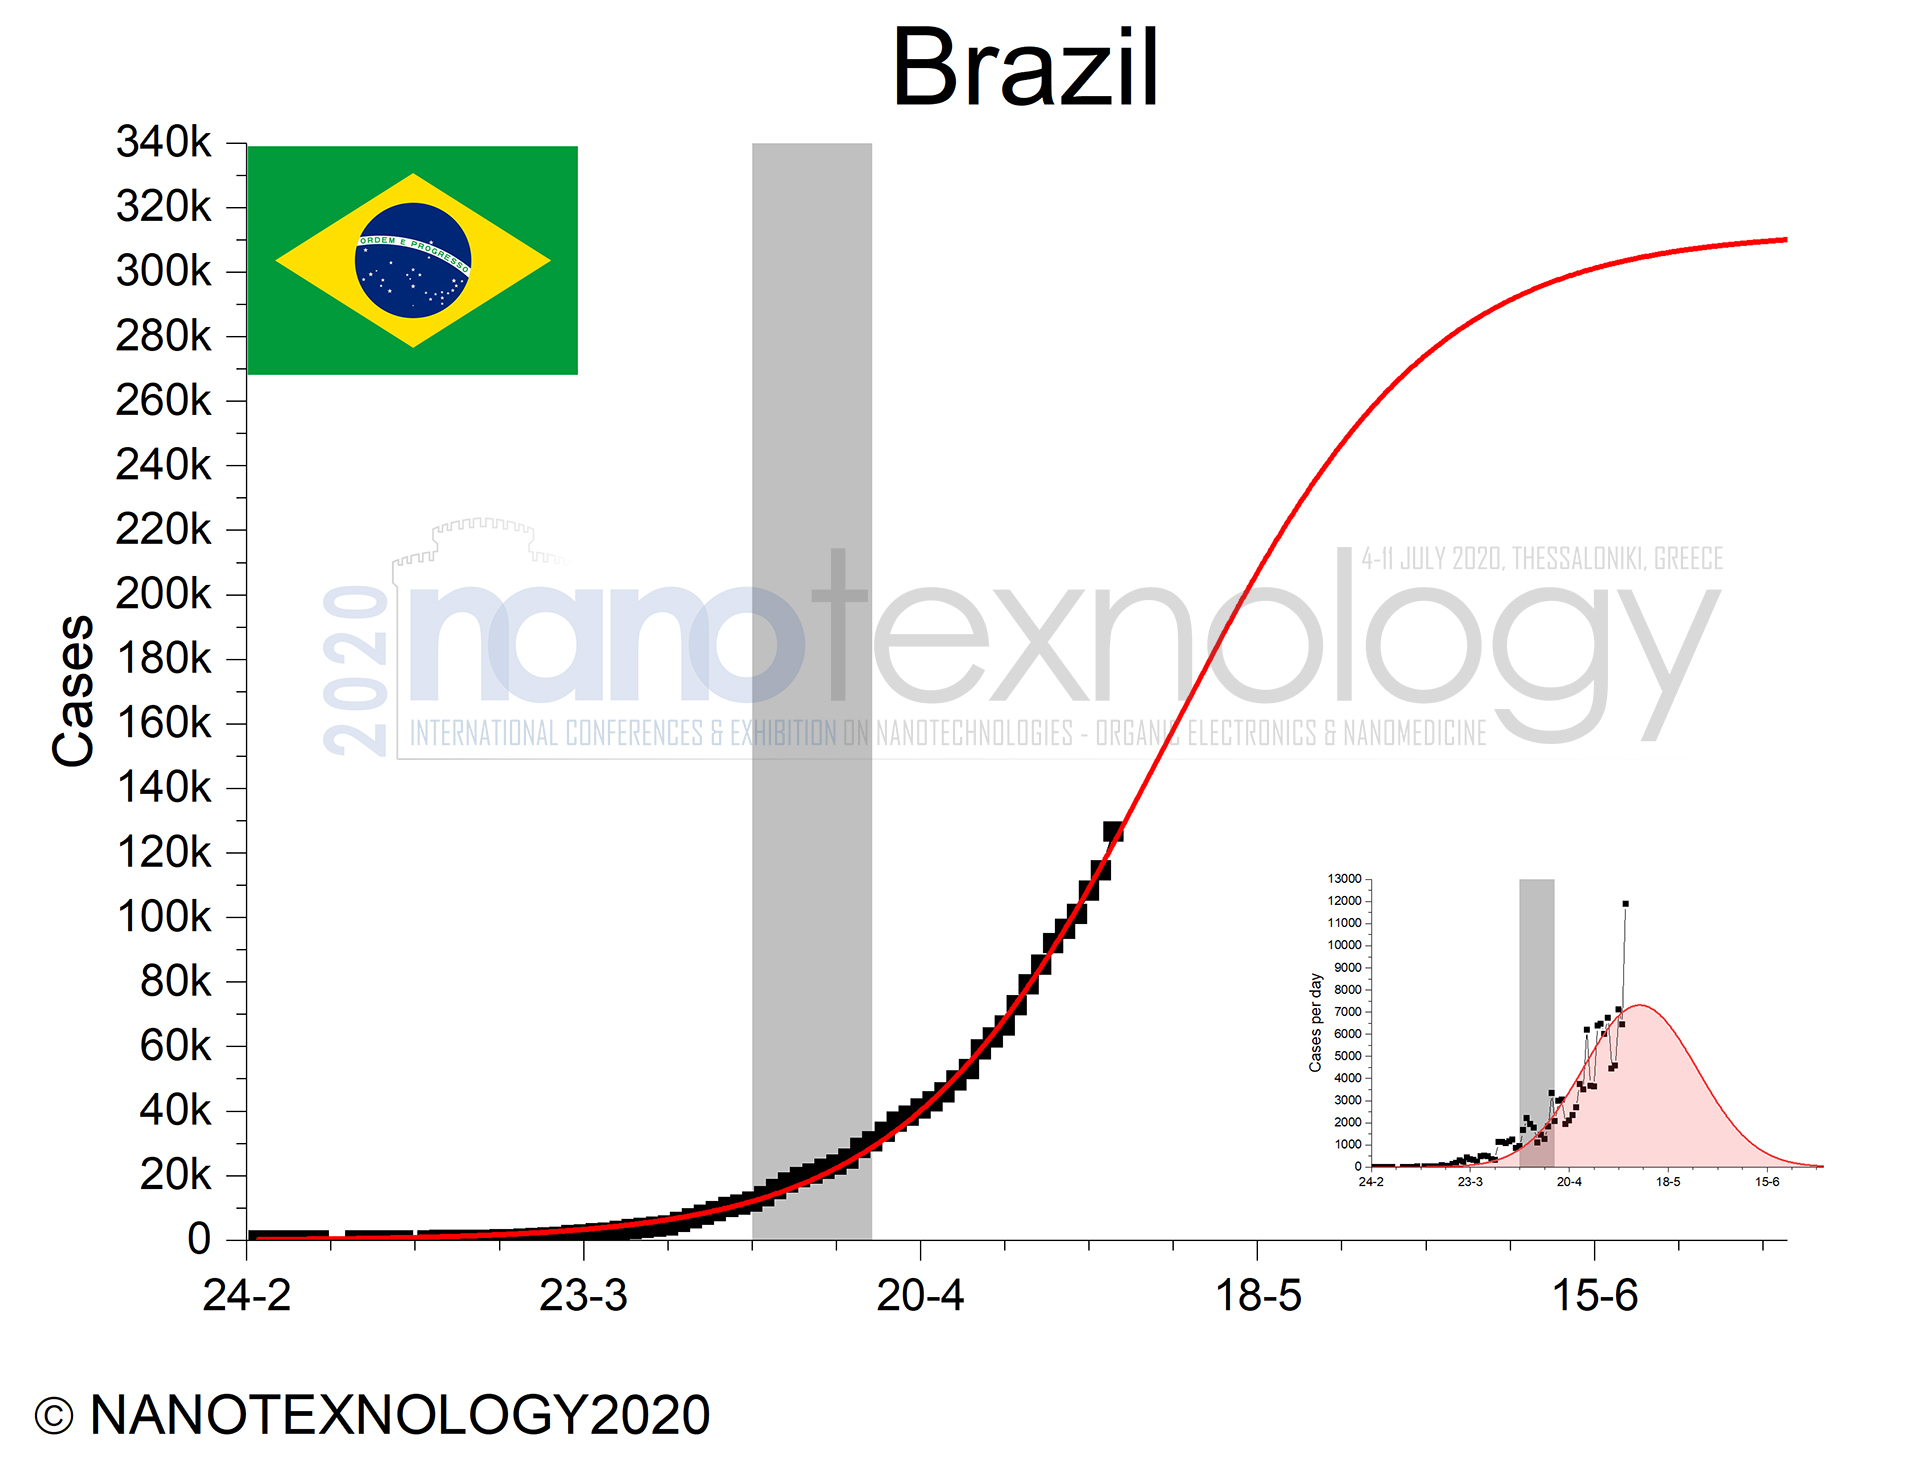
According to these continuously updated predictions, it seems that most geographical areas and countries are now within the second phase of infection cases while some others such as Brazil and Russia are still in the first phase. These observations resulted from the analysis of the total cases for each country with the S-curve and Gaussian models. The figures below are shown the S-curves fitted results (solid red lines), while in the insets are the corresponding derivatives, describing the evolution of total cases and the cases-per-day, respectively.
In this third communication, we include some studies on countries of interest or some group of countries which either passed early the first phase of COVID-19 spreads and now are in the end of second phase such as S. Korea, Austria, Israel, etc or some group of countries with considerable interest since they exhibit for example, an enormous COVID-19 spread again, such as Japan, Taiwan and Singapore. We also present the case of European countries that were suffered significant the previous two months and now are after the middle of the second phase, and their governments are lifting lockdown faster in order to reduce the economic consequences. In any case, we think that our results and predictions on the COVID-19 evolution could help to this direction in order to apply specific plans and approaches.
We would like to have your feedback on these studies and predictions that can help all of us to deal with this unprecedented situation with professionalism, and to help our colleagues and family, and fellow citizens, both in the next door and across the globe.
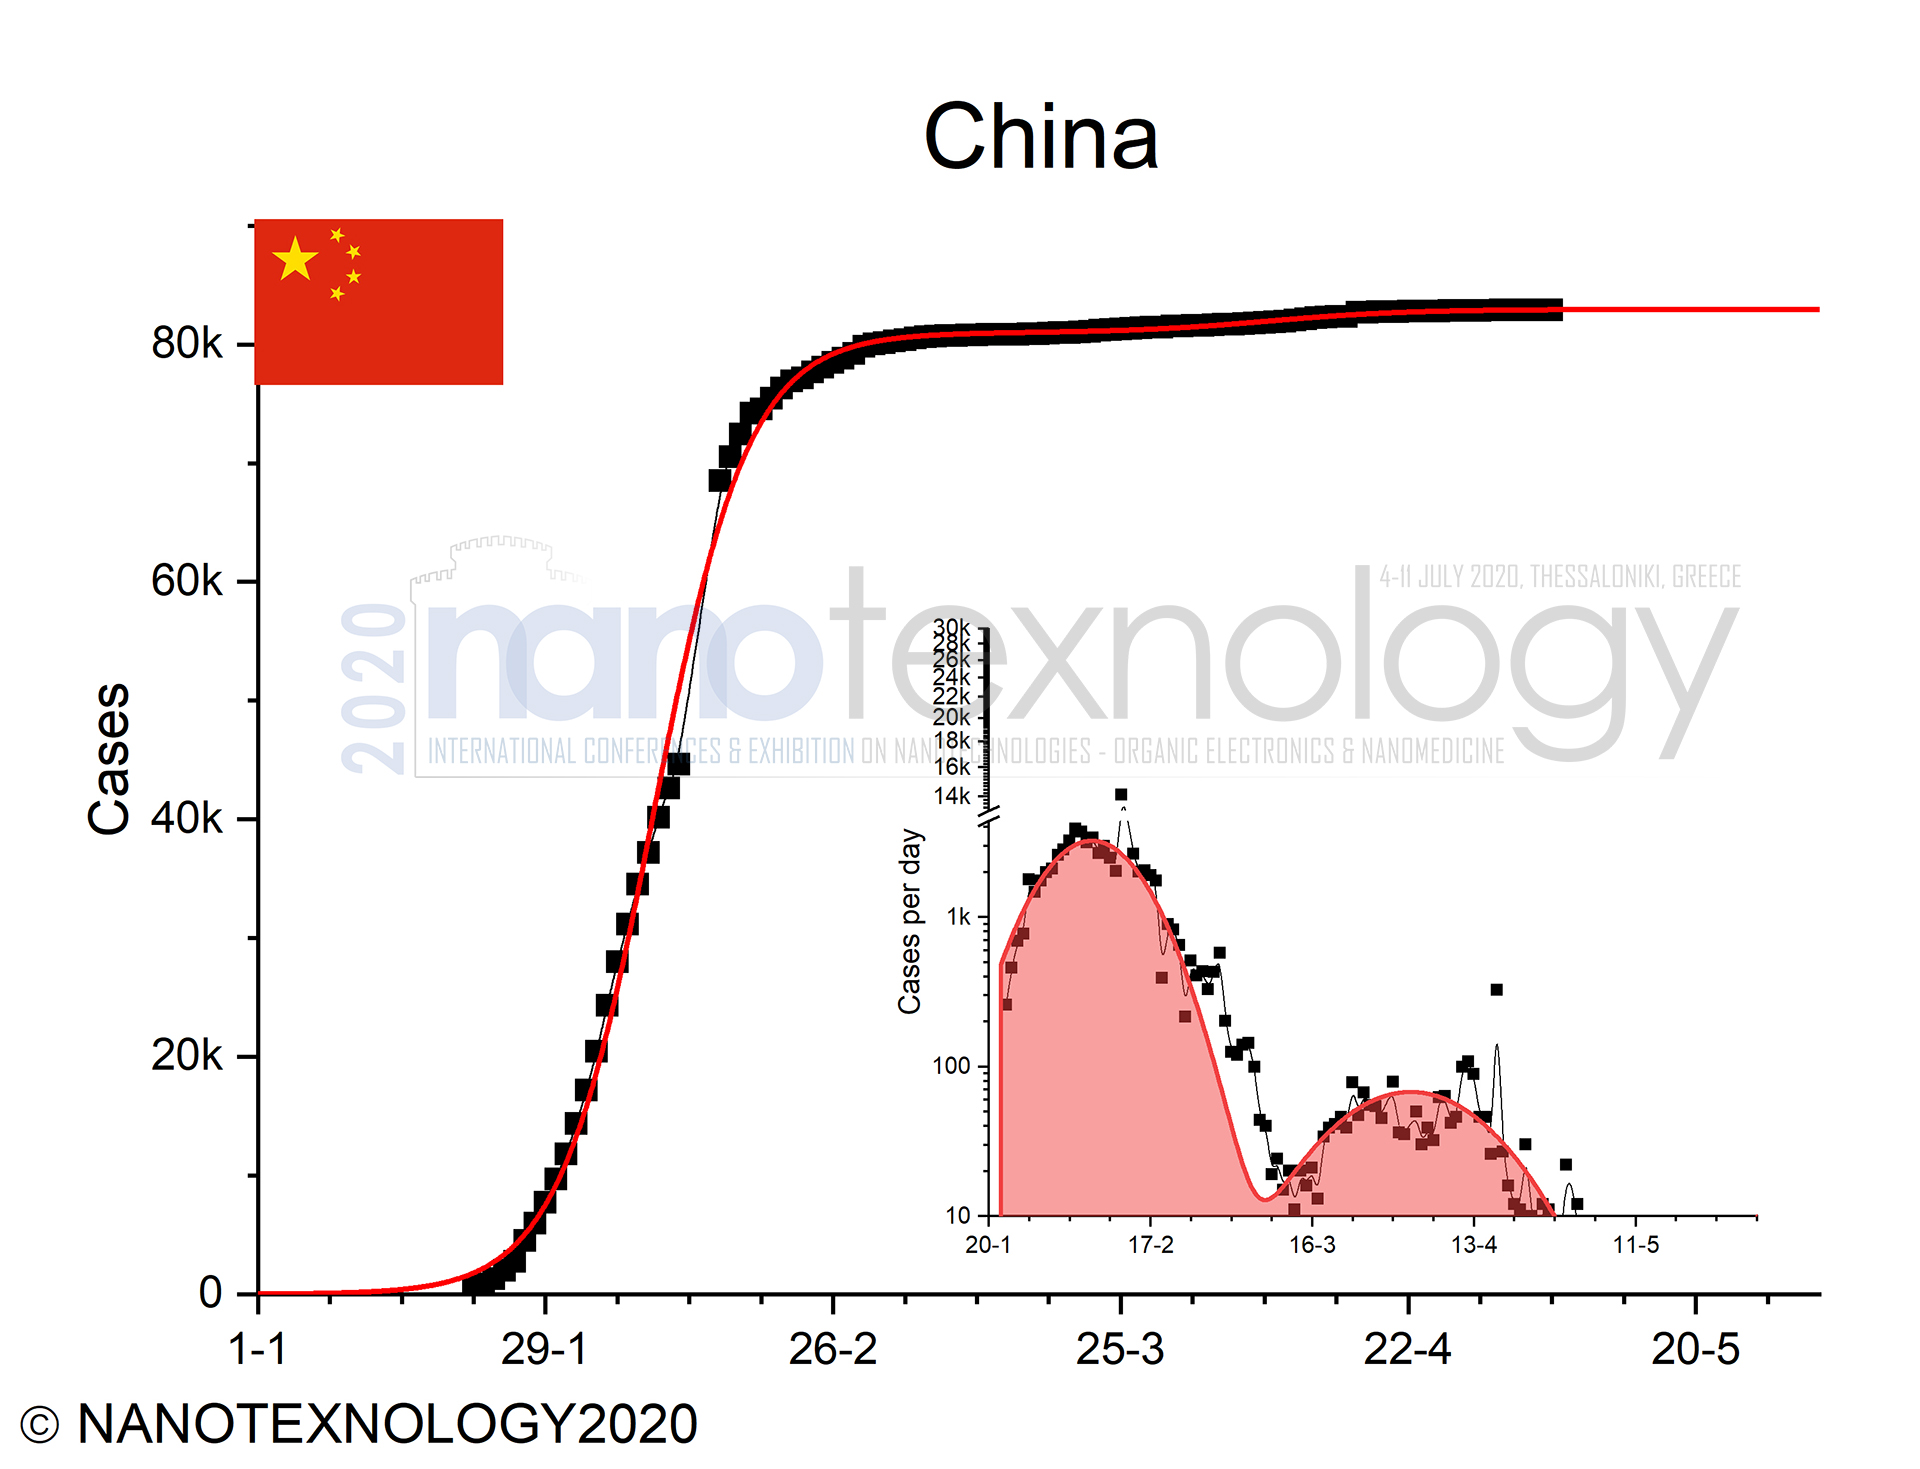
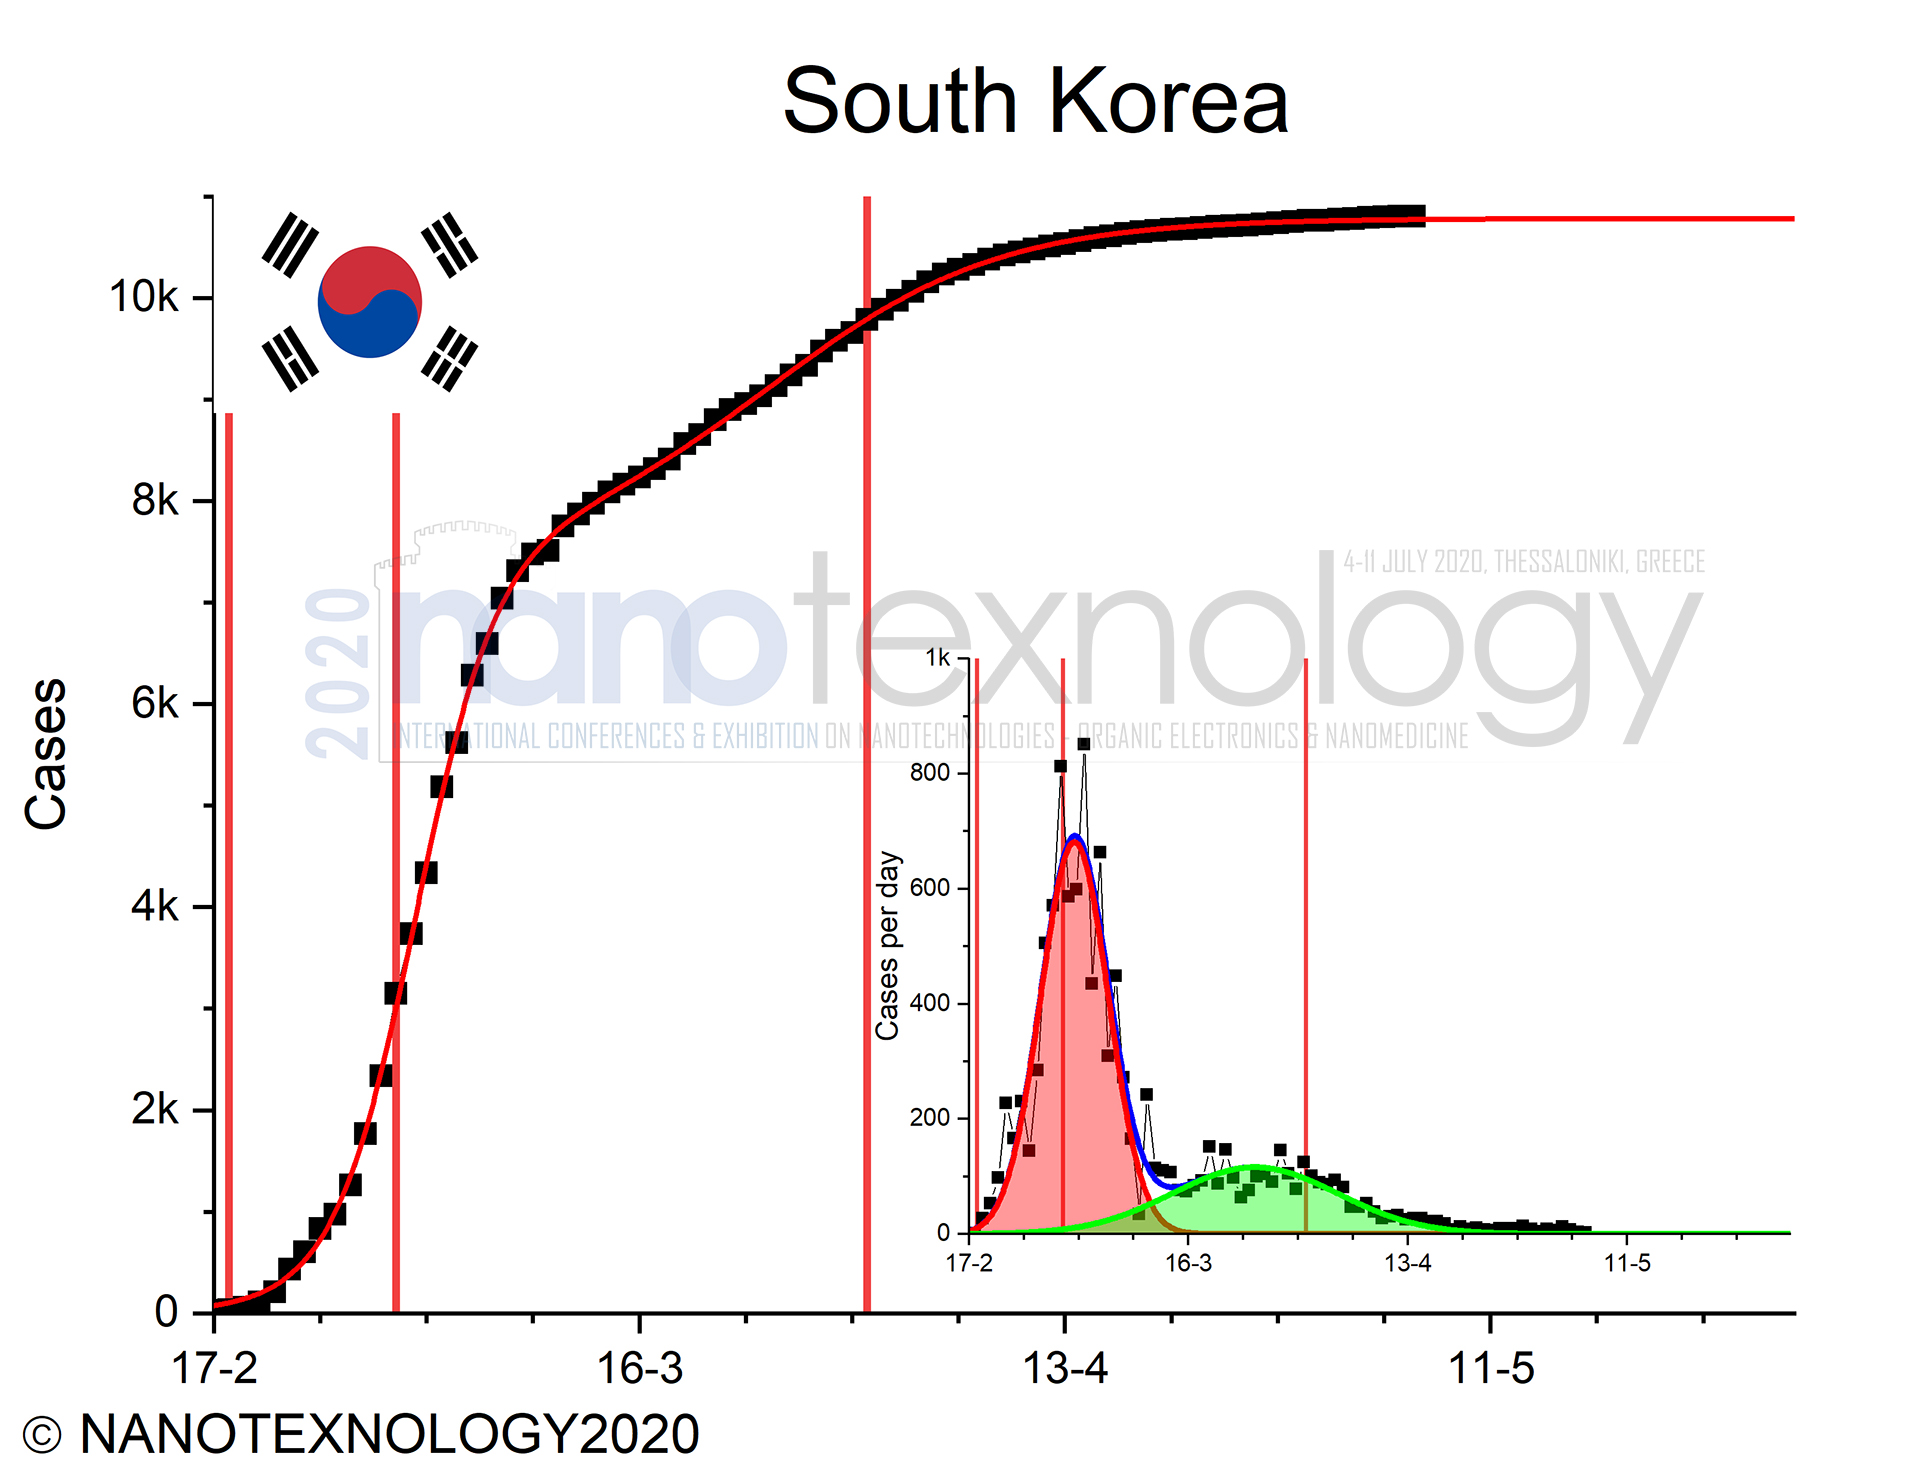
A. Cases of China and South Korea
China and South Korea have reached the confirmed cases plateau end (end of first phase), very early in February and middle March, respectively. These two countries also have reached the end of the second phase few weeks ago, as it is showed in Fig. 1. The case of South Korea is remarkable, due to the shape of S-curve, indicating that after the first phase of COVID-19 spread, the second phase took over.
 |
 |
|
Figure 1: China and South Korea COVID-19 Case Studies |
||
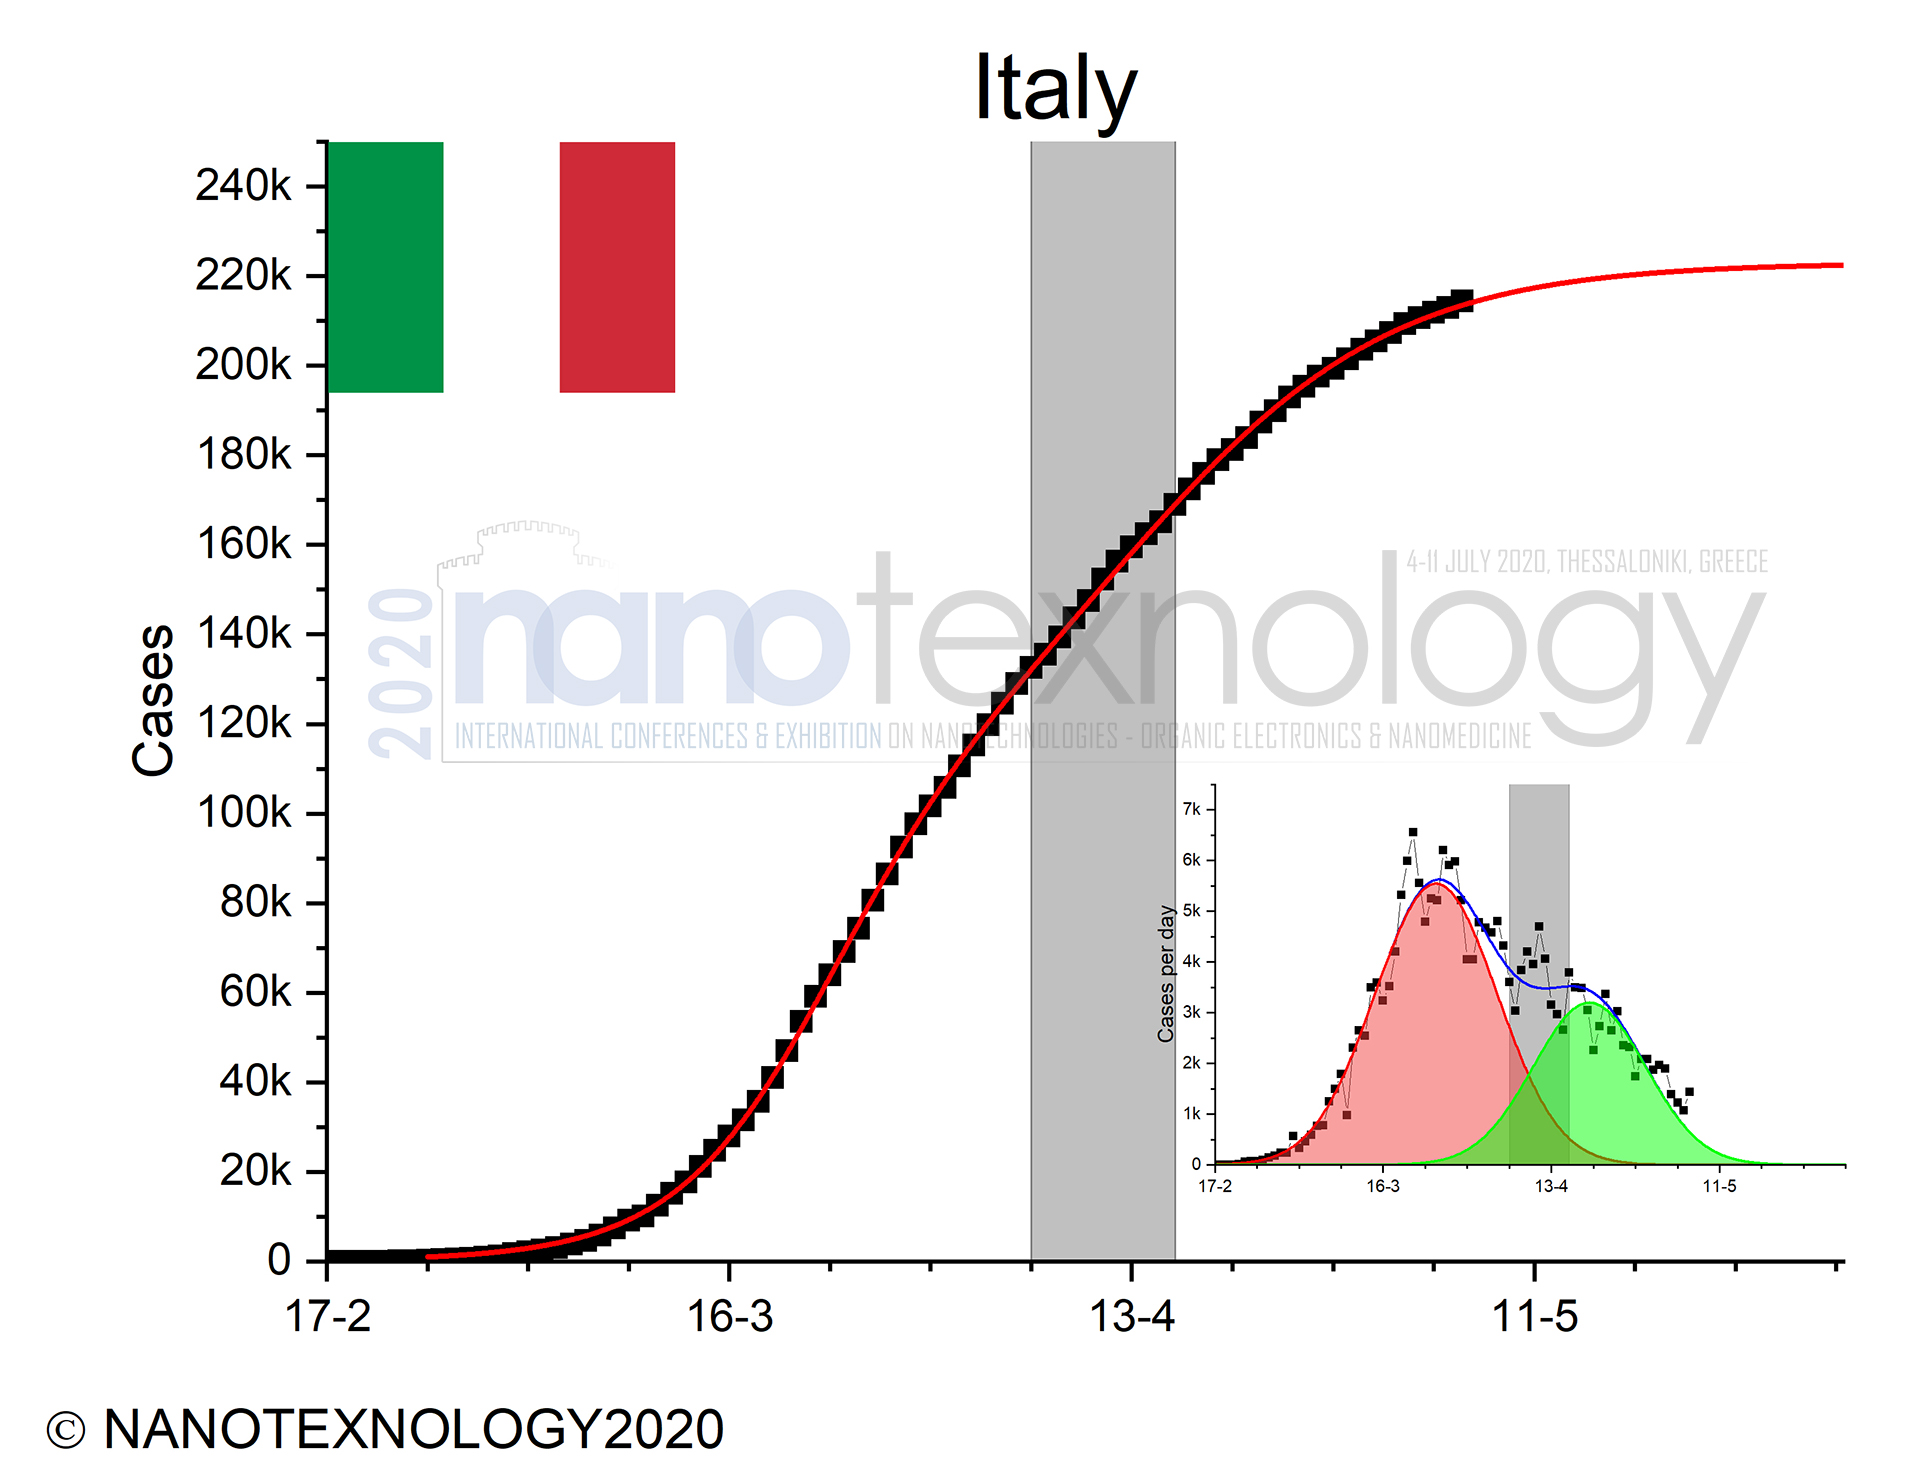
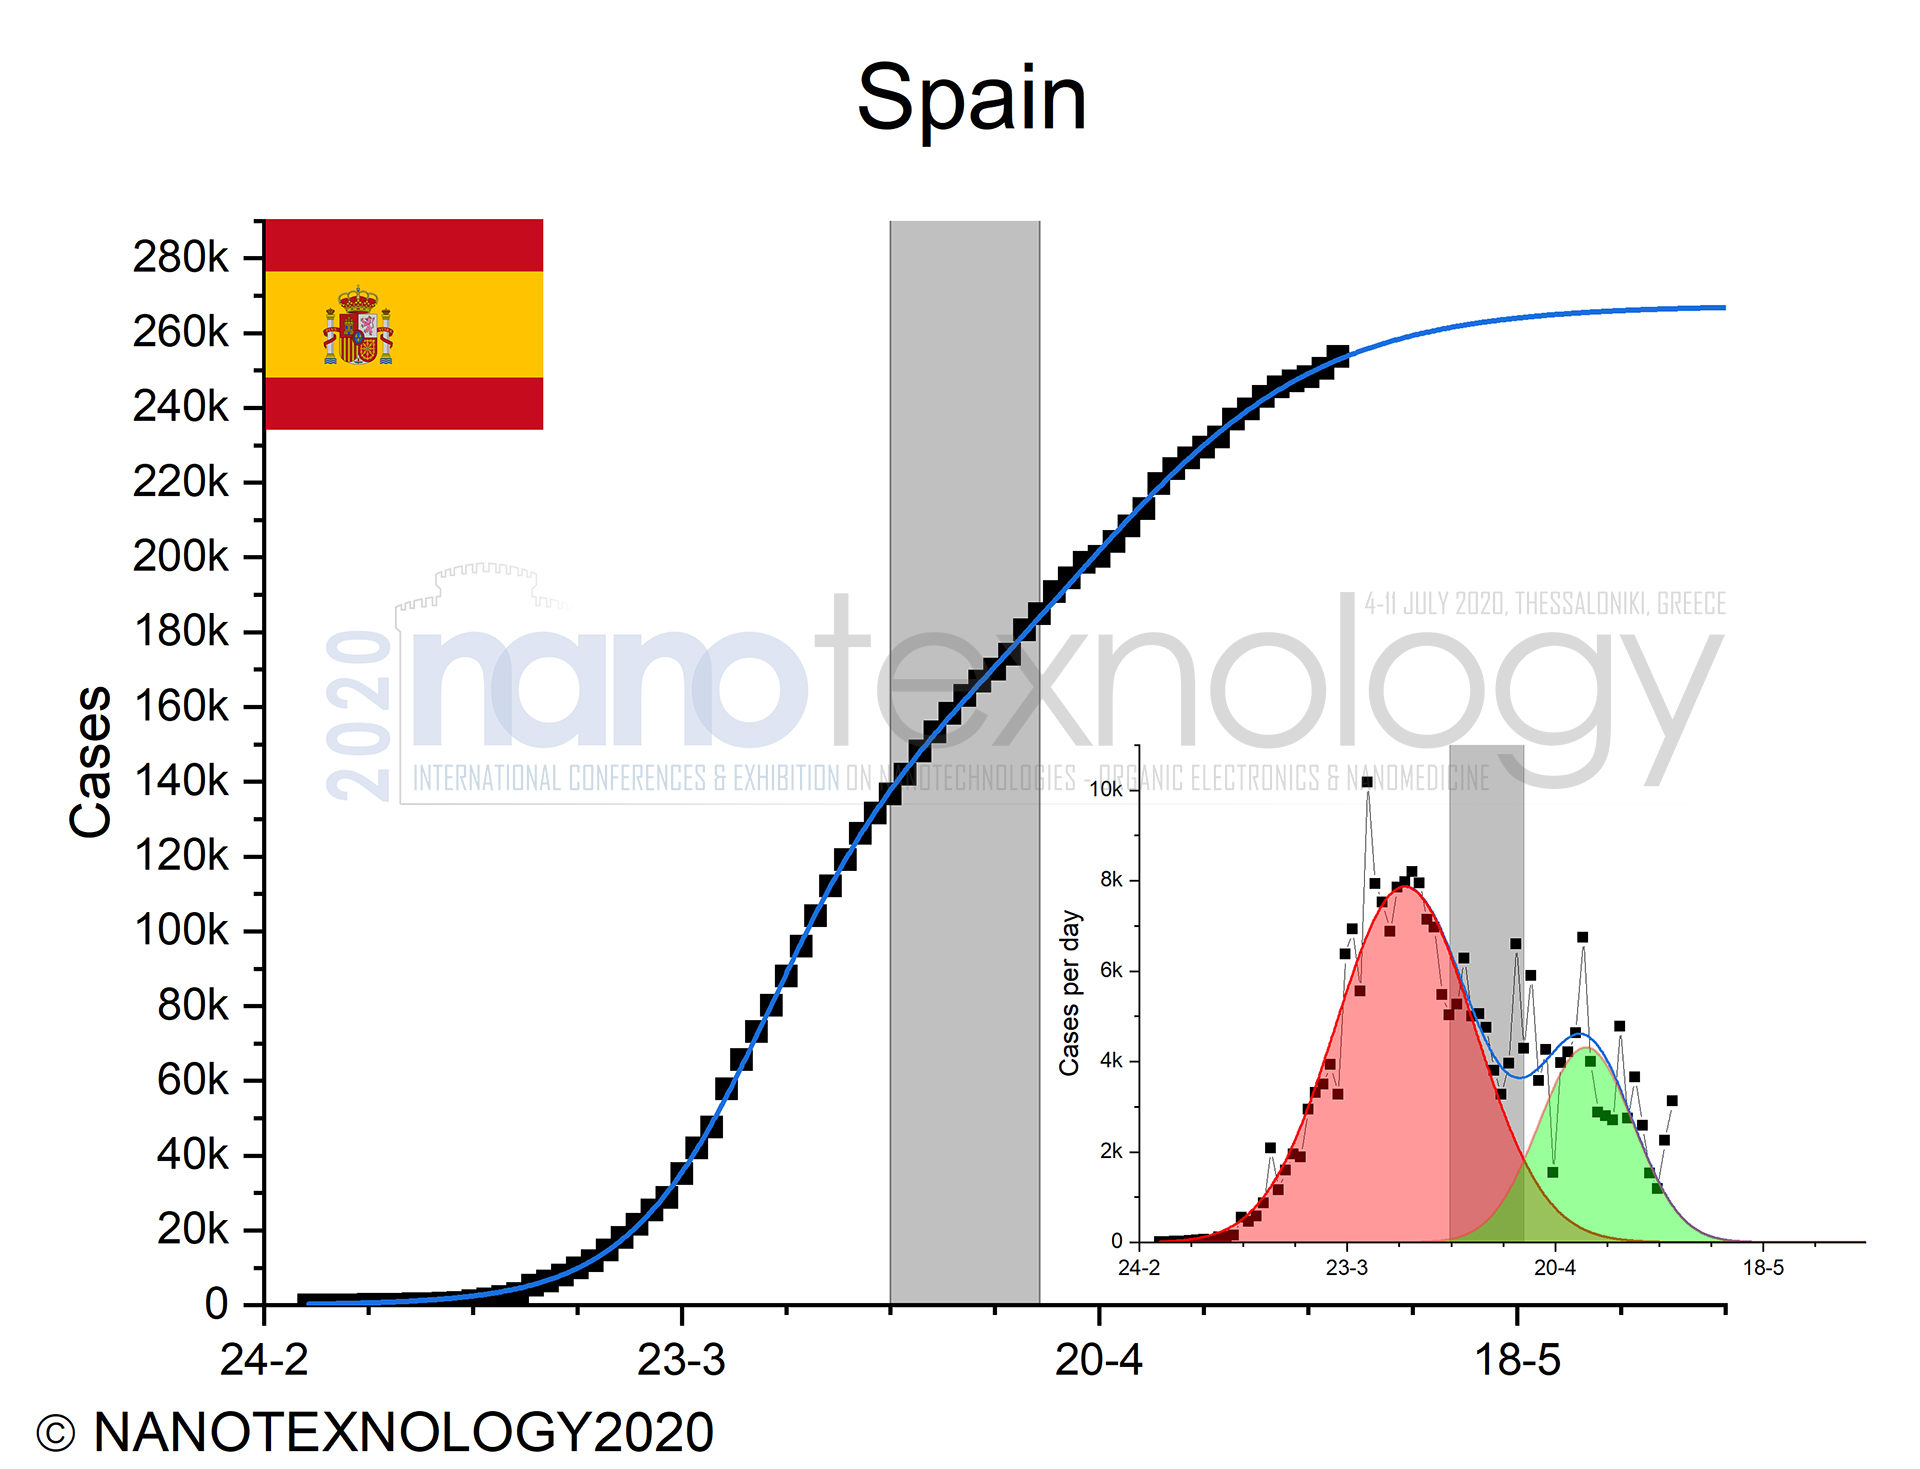
B. After lockdown period evolution
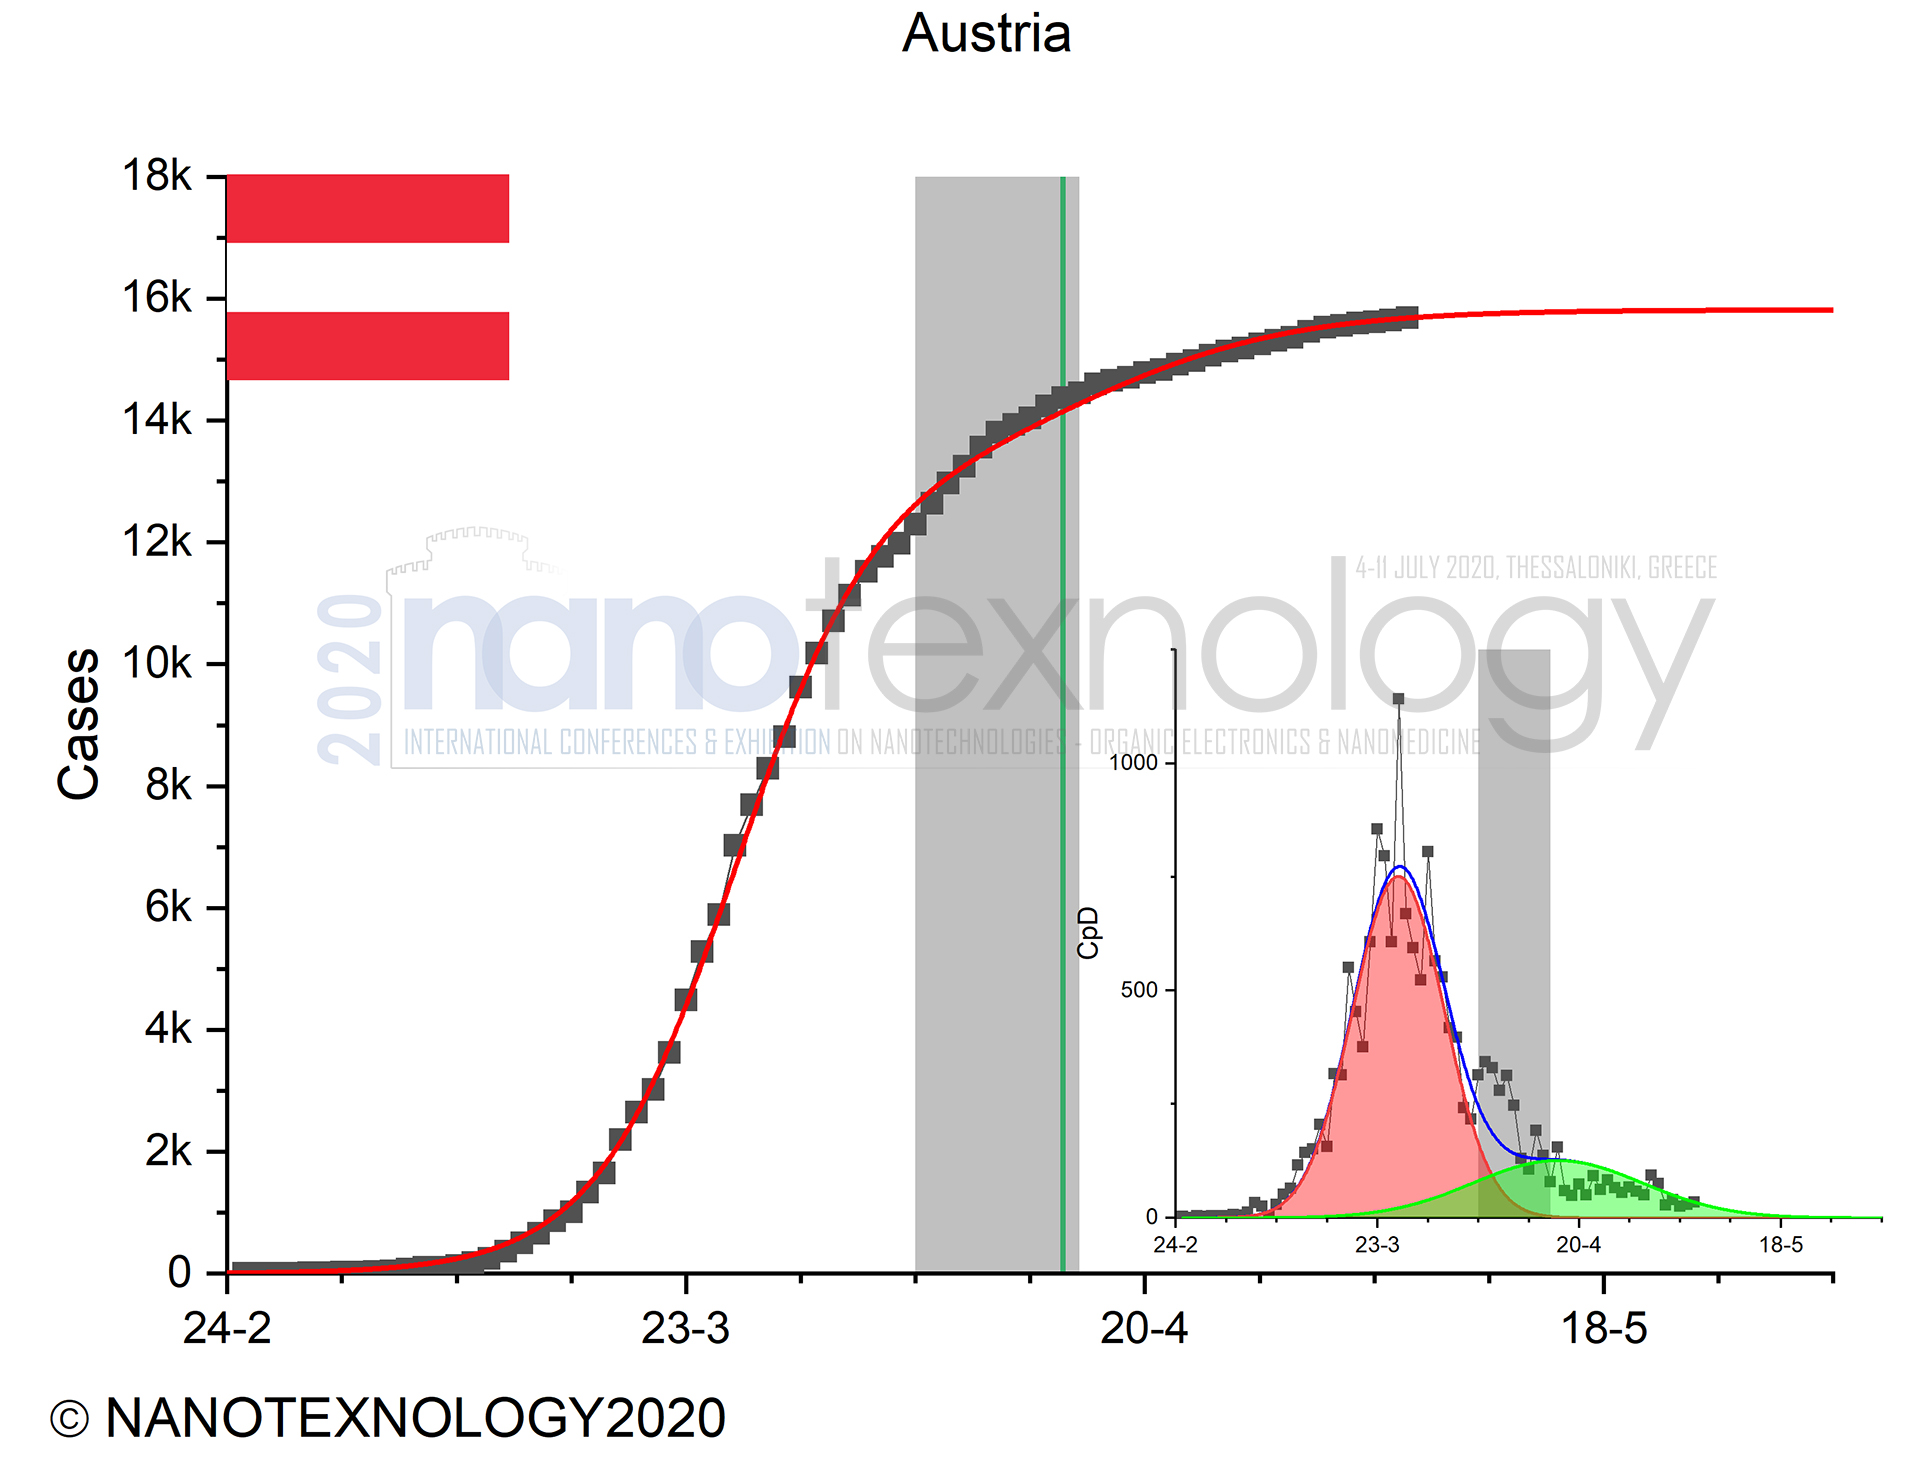
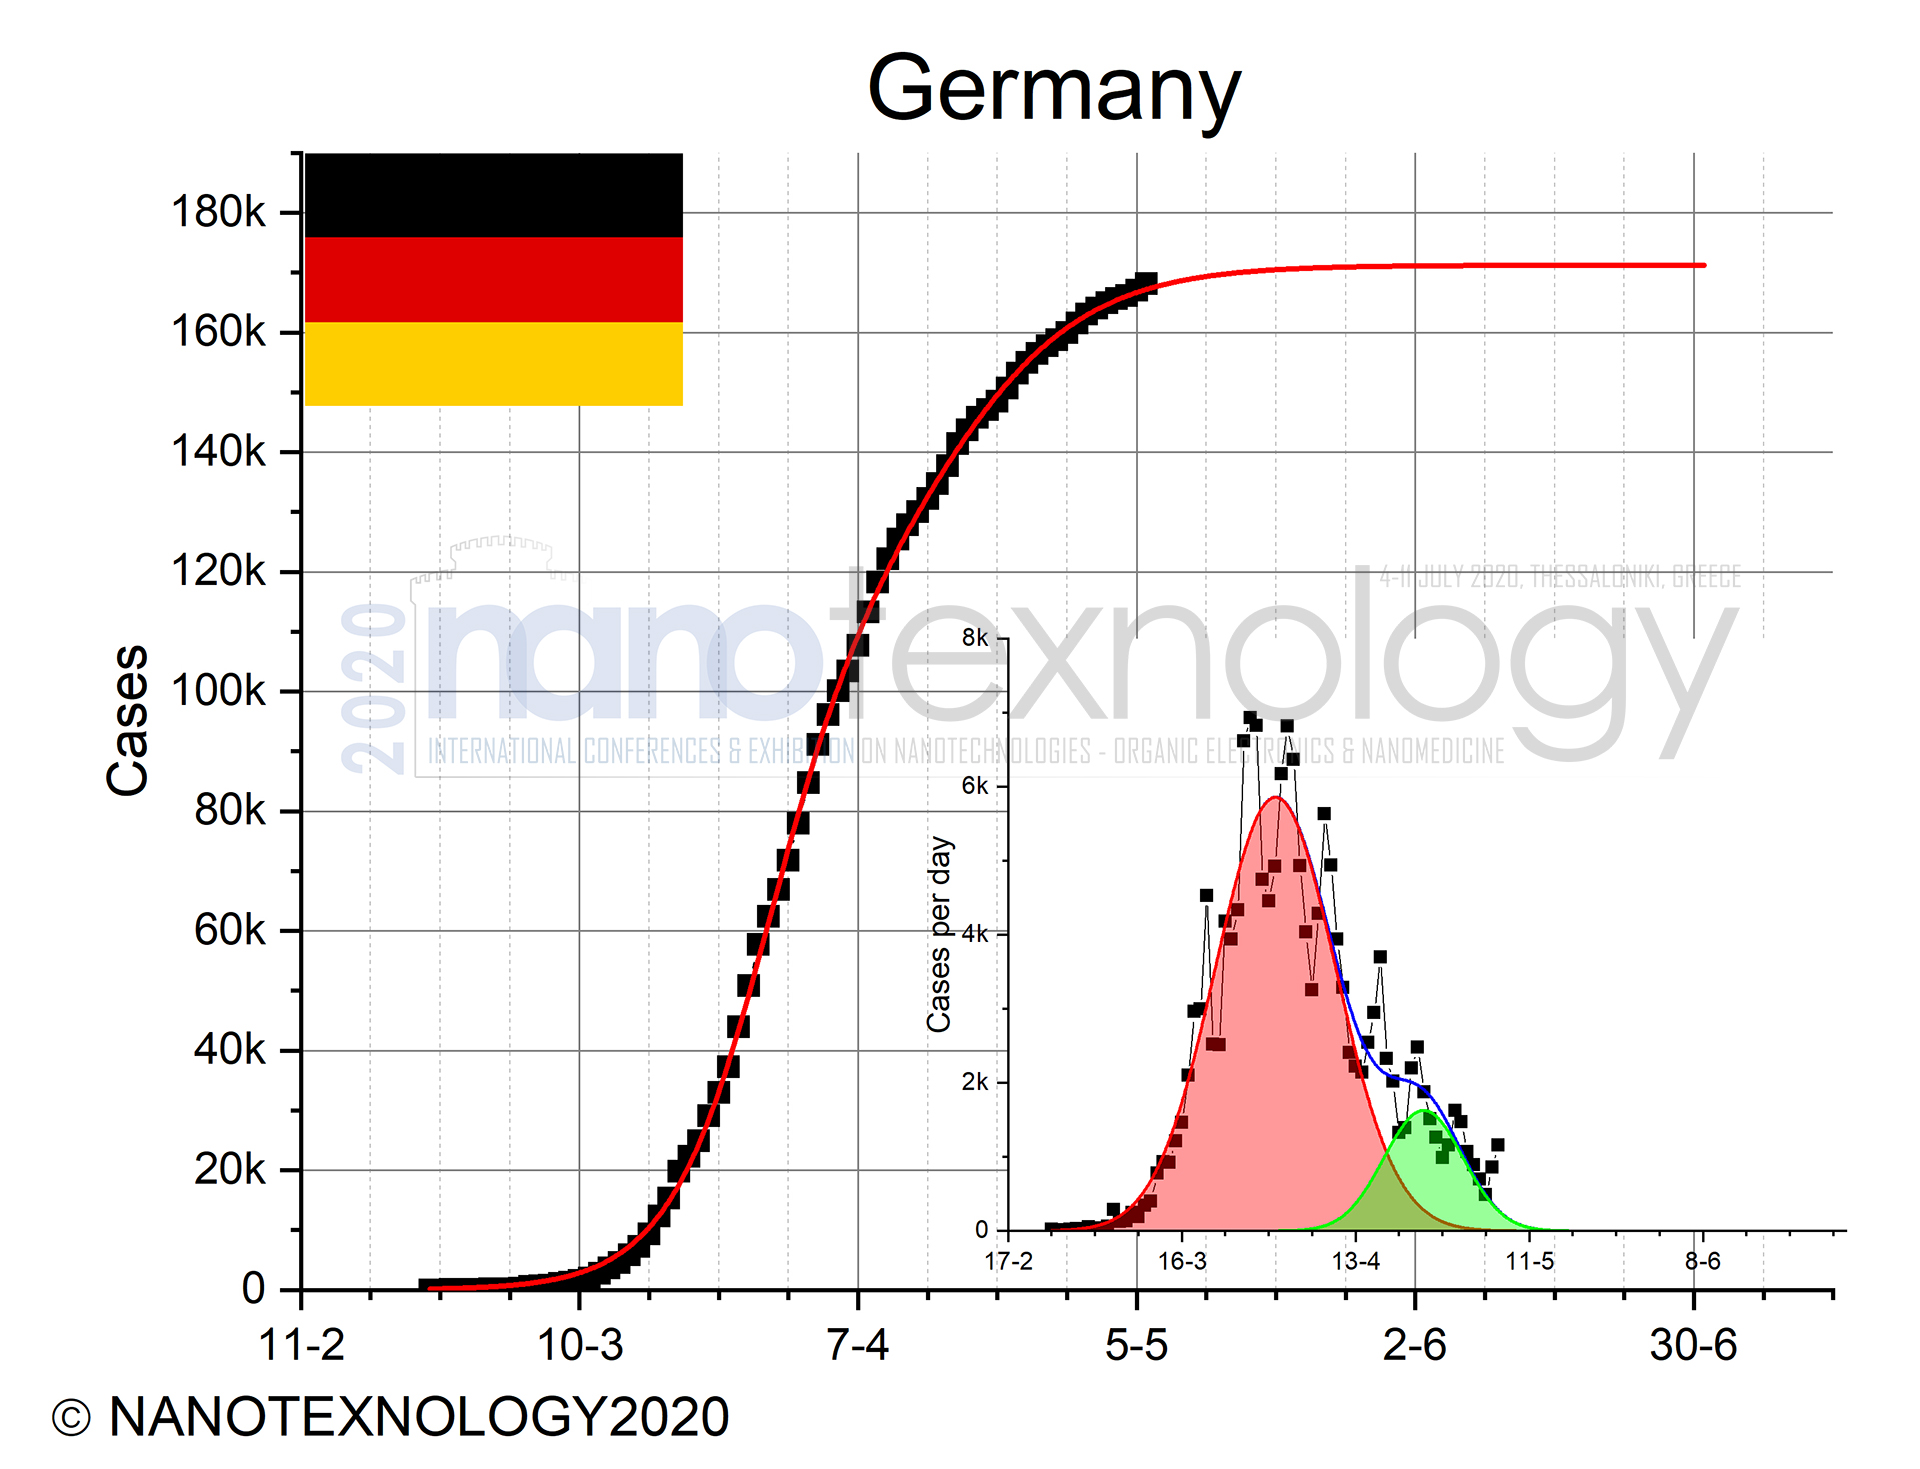
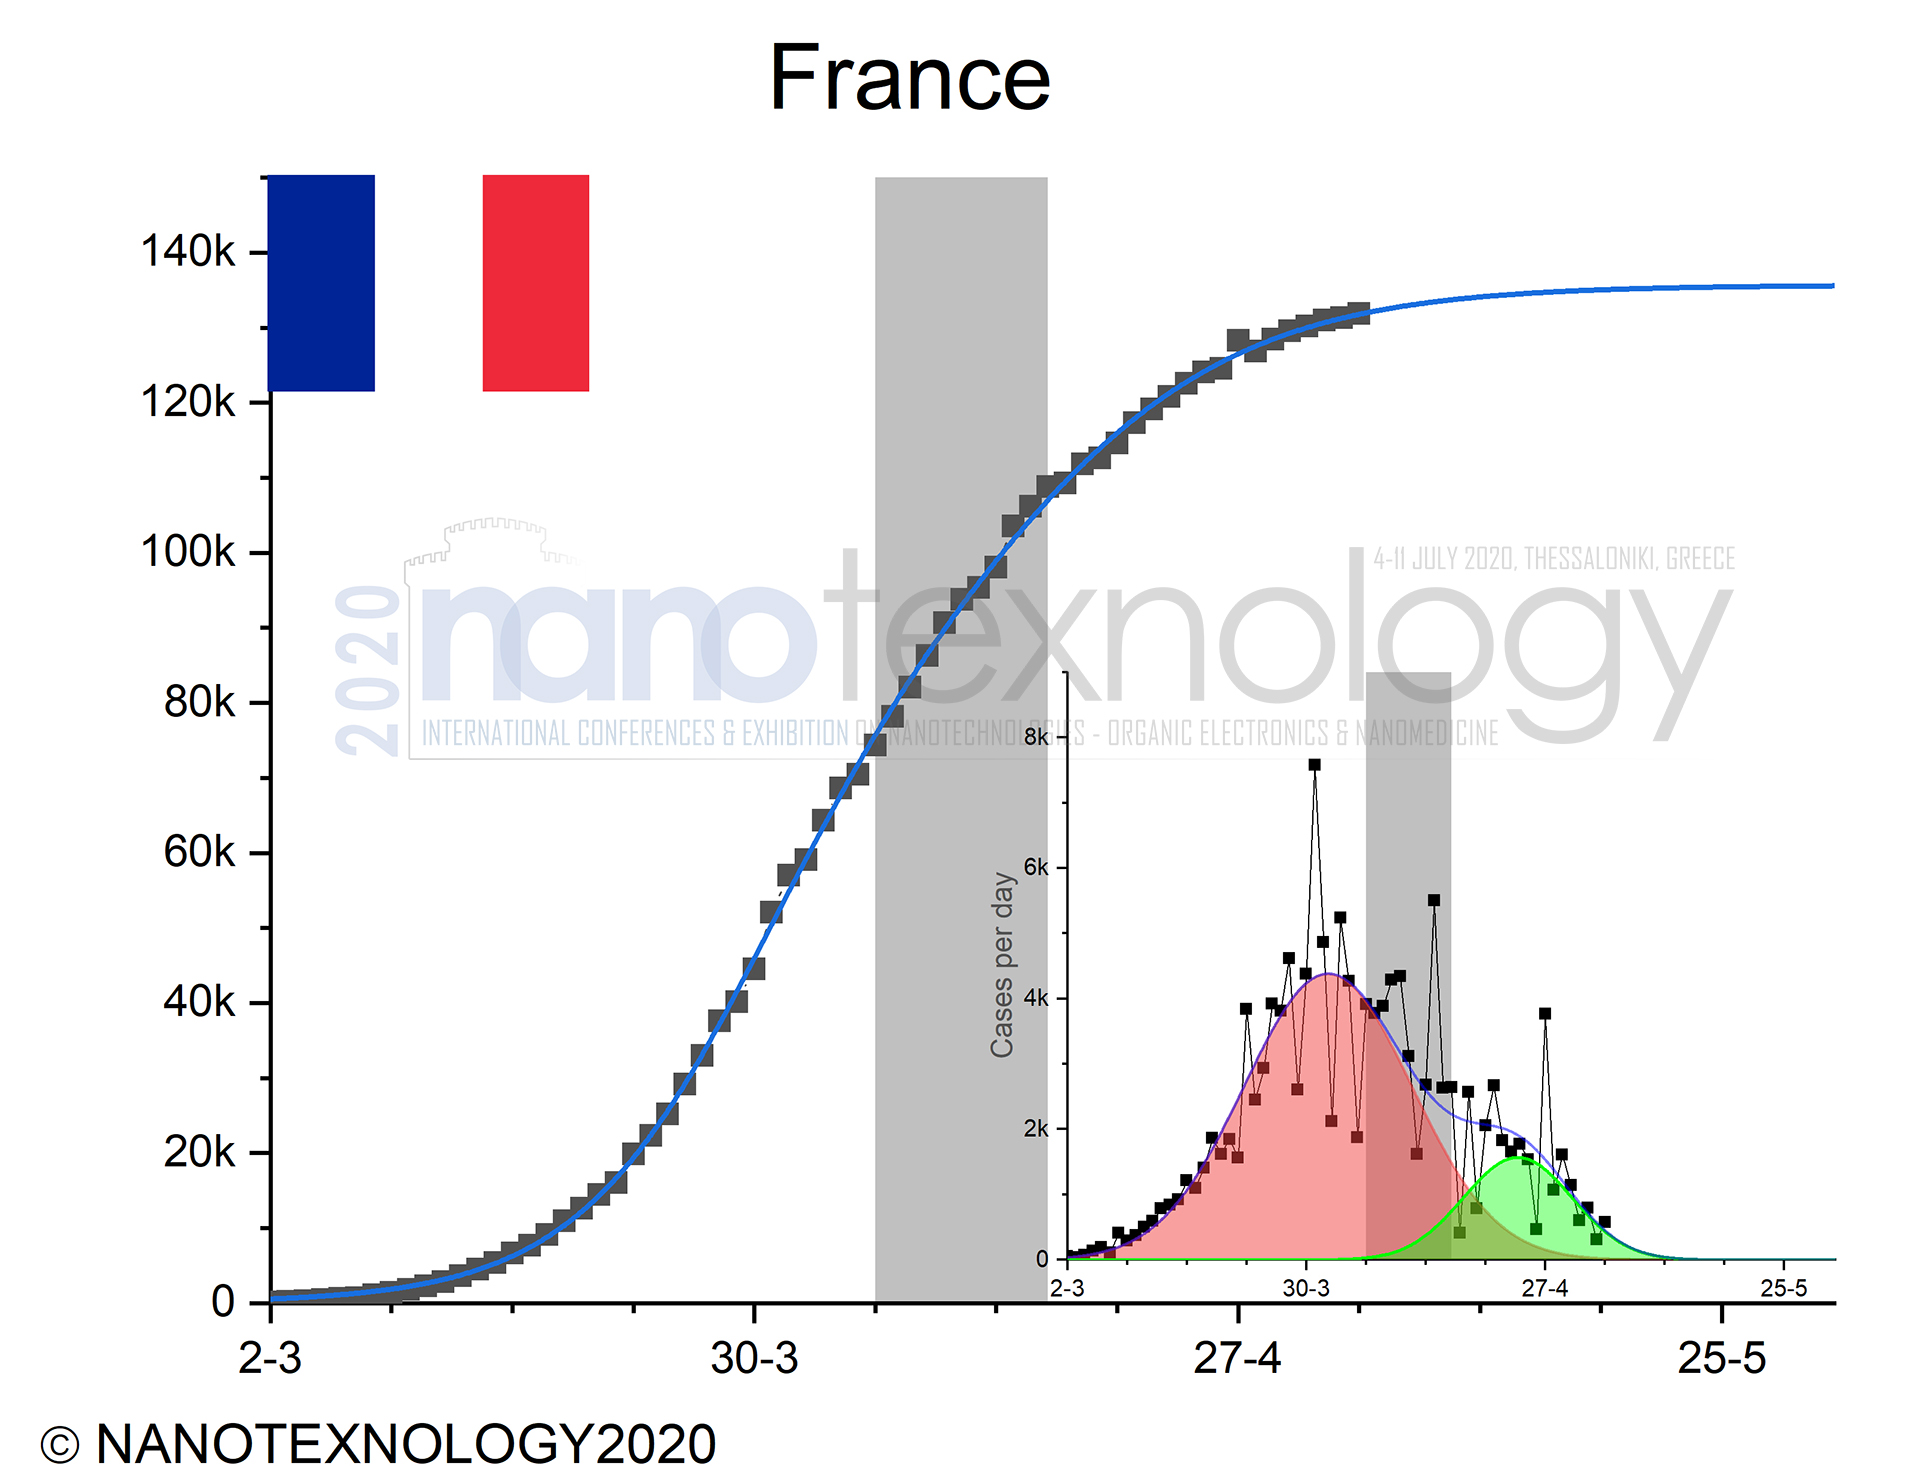
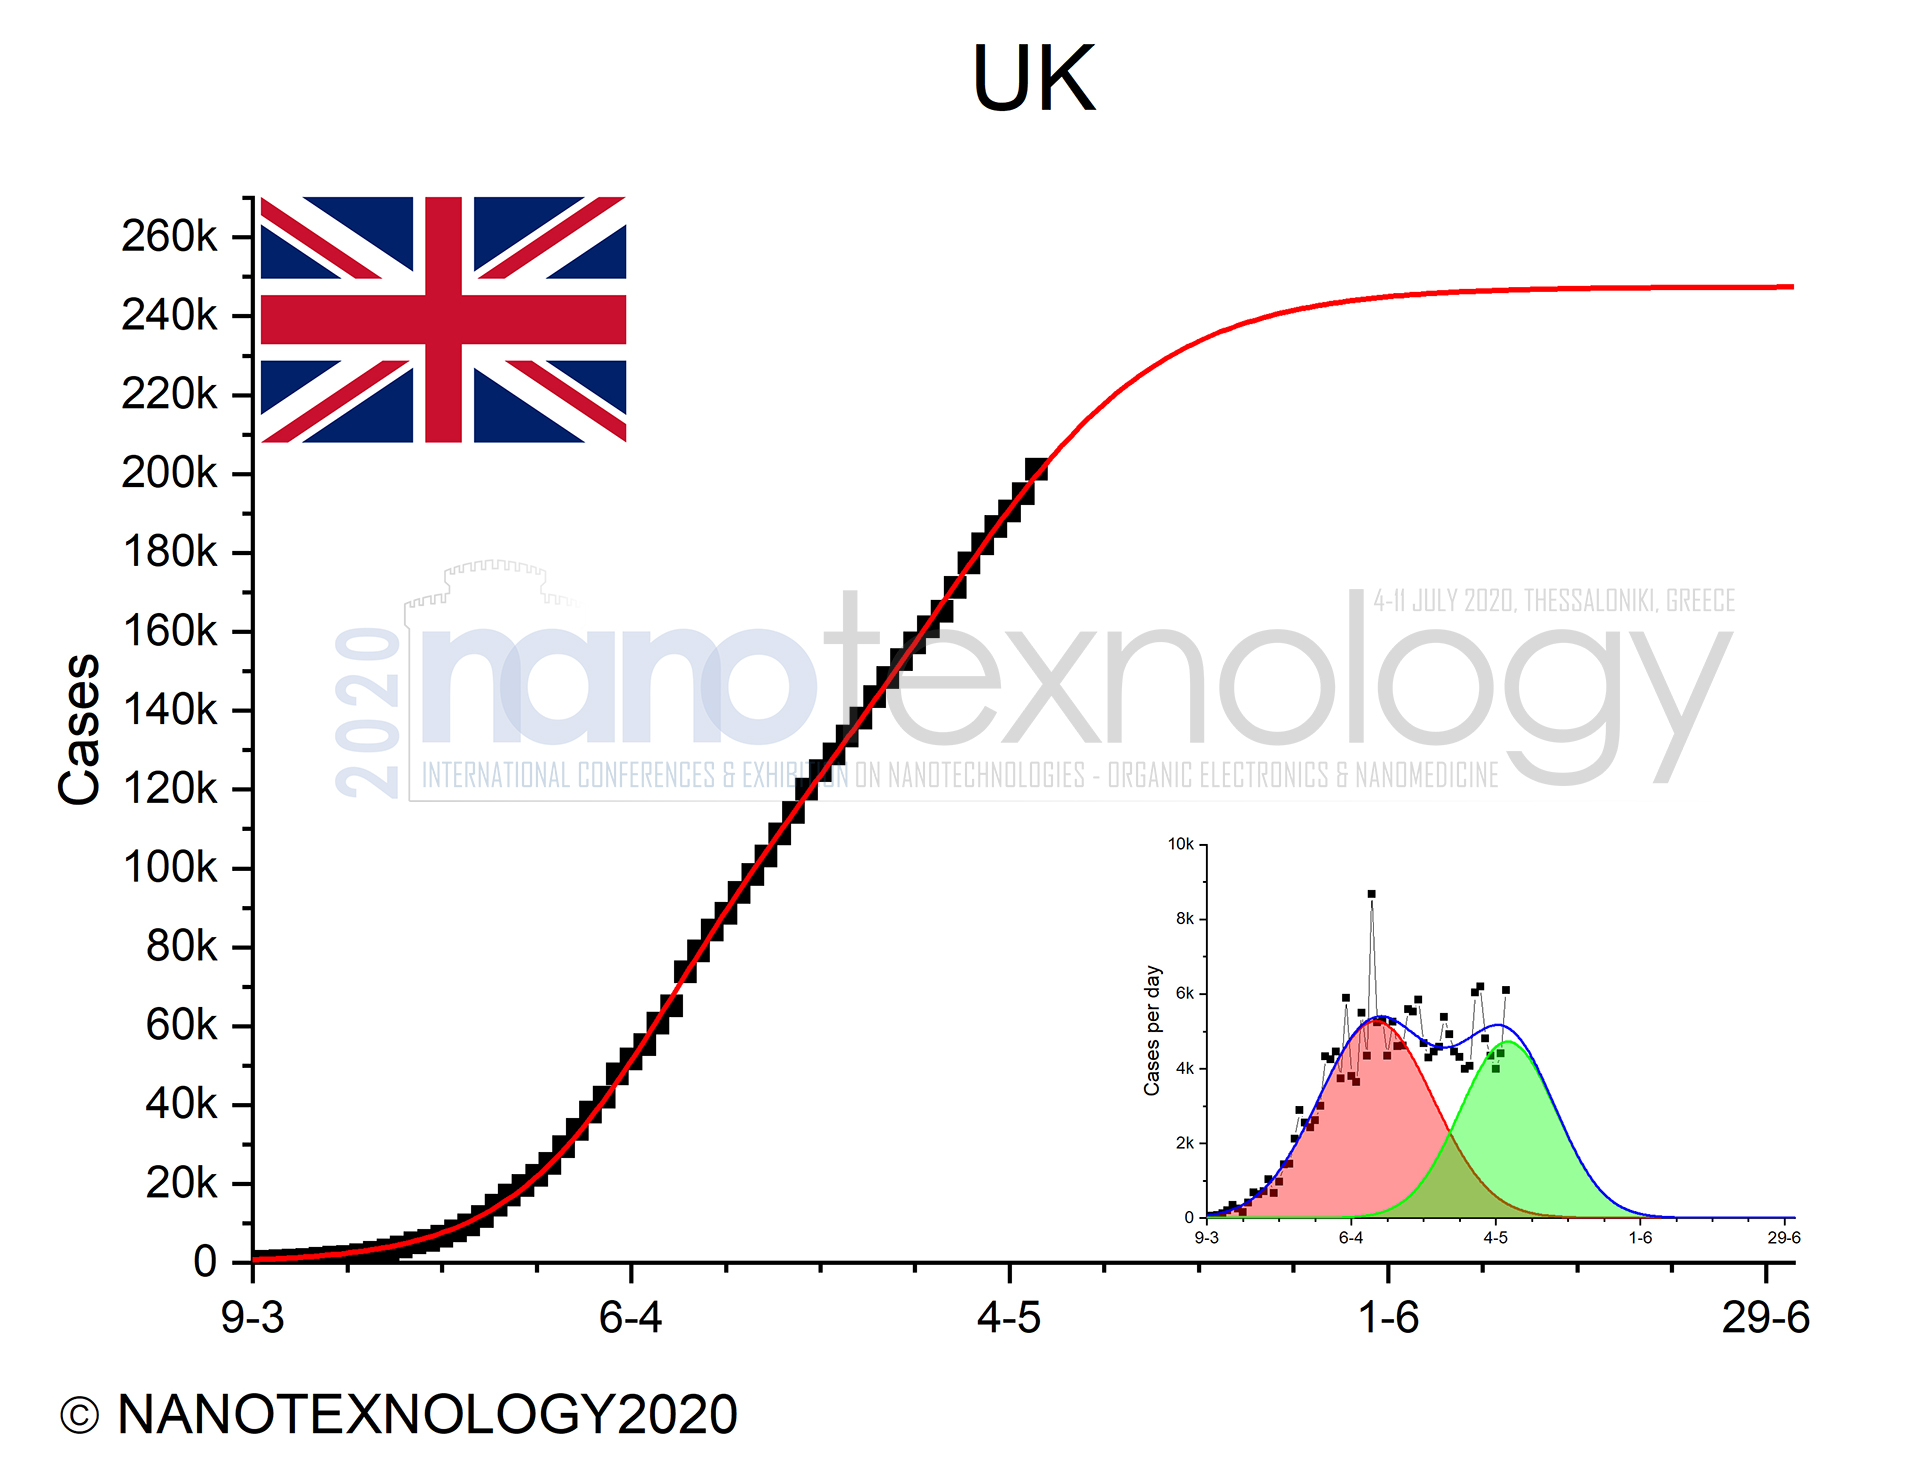
Except, from Austria, the other three central European countries, that are discussed below, reported higher number of confirmed cases. All European countries already reached the first phase plateau in the beginning of May, as predicted by the S-curves in Fig. 2.
In the case of Mediterranean Countries Italy and Spain, and Central Europe Germany, Austria and France, but also UK and Brazil from South America, the COVID-19 spread during the Catholic Easter period was enormous. Of course, during Catholic Easter (grey areas in Fig. 2 graphs), the number of cases per day showed deviations from the expected bell-shaped line indicating that people are holding holiday gatherings, even though a lockdown for all counties was issued. This was the beginning of the second phase for almost all European countries (see Fig.2). Only for Brazil the cases are still raising every day and seems that Brazil will follow the fate of most European countries.
 |
 |
|
 |
 |
|
 |
 |
|
 |
||
Figure 2: Study of COVID-19 cases during Catholic Easter |
||
C. The case of Greece
Until today 2,642 cases have been reported. The Ministry of Health, took all measures to delay the COVID-19 spread in the beginning of March and Complete lockdown on 23rd of March.
However, the Orthodox Easter period (13 to 22 April), the gray area in Fig. 3, was a critical period to test and to compare COVID-19 spread with the one of Italy and Spain (the Catholic Easter a week earlier). On 21st of April, 150 new confirmed cases were reports for the town Kranidi and specifically from the refugee facility. Such events raised the cumulative number of confirmed cases and changed a bit the evolution on the spread across the country.
Finally, on 4th May (green vertical line in Fig. 3) the Greek government started reducing step-by-step measures. We assume that a plan with a maximum of cases between 7-10, will be a good plan for this second phase. This is simulated by the green Gaussian line and description shown in the inset of Fig. 3. Based on that it is expected that by the first week of June the confirmed cases plateau will be reached. Thus, we expect the total cases plateau will reach higher values as it is shown with the blue line in Fig. 3.
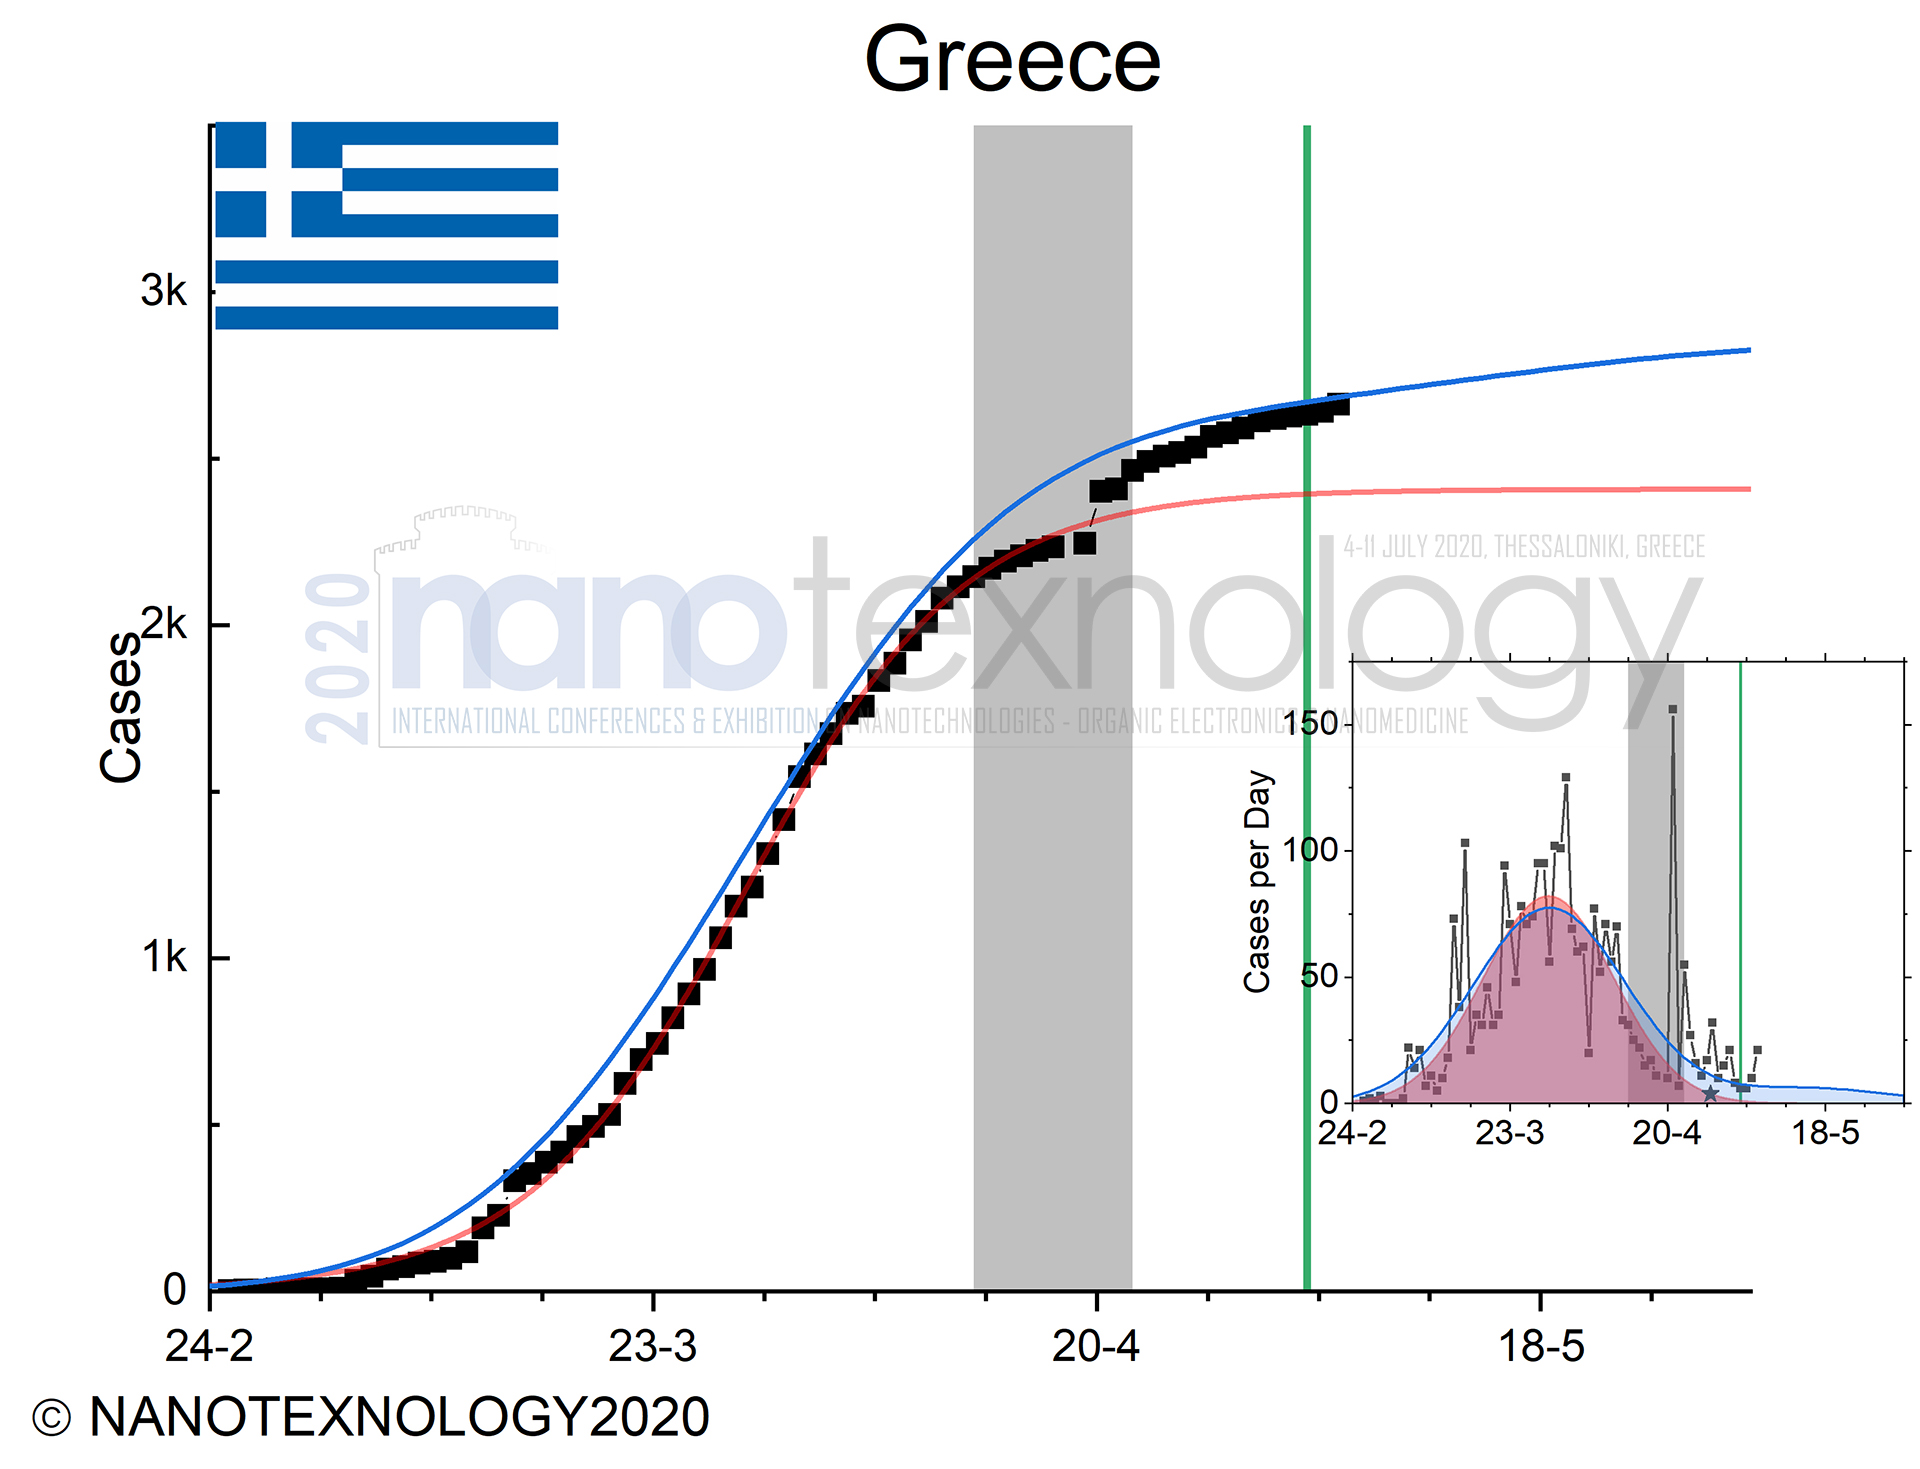 |
Figure 3: Study of COVID-19 spread in Greece |
D. Japan, Singapore cases
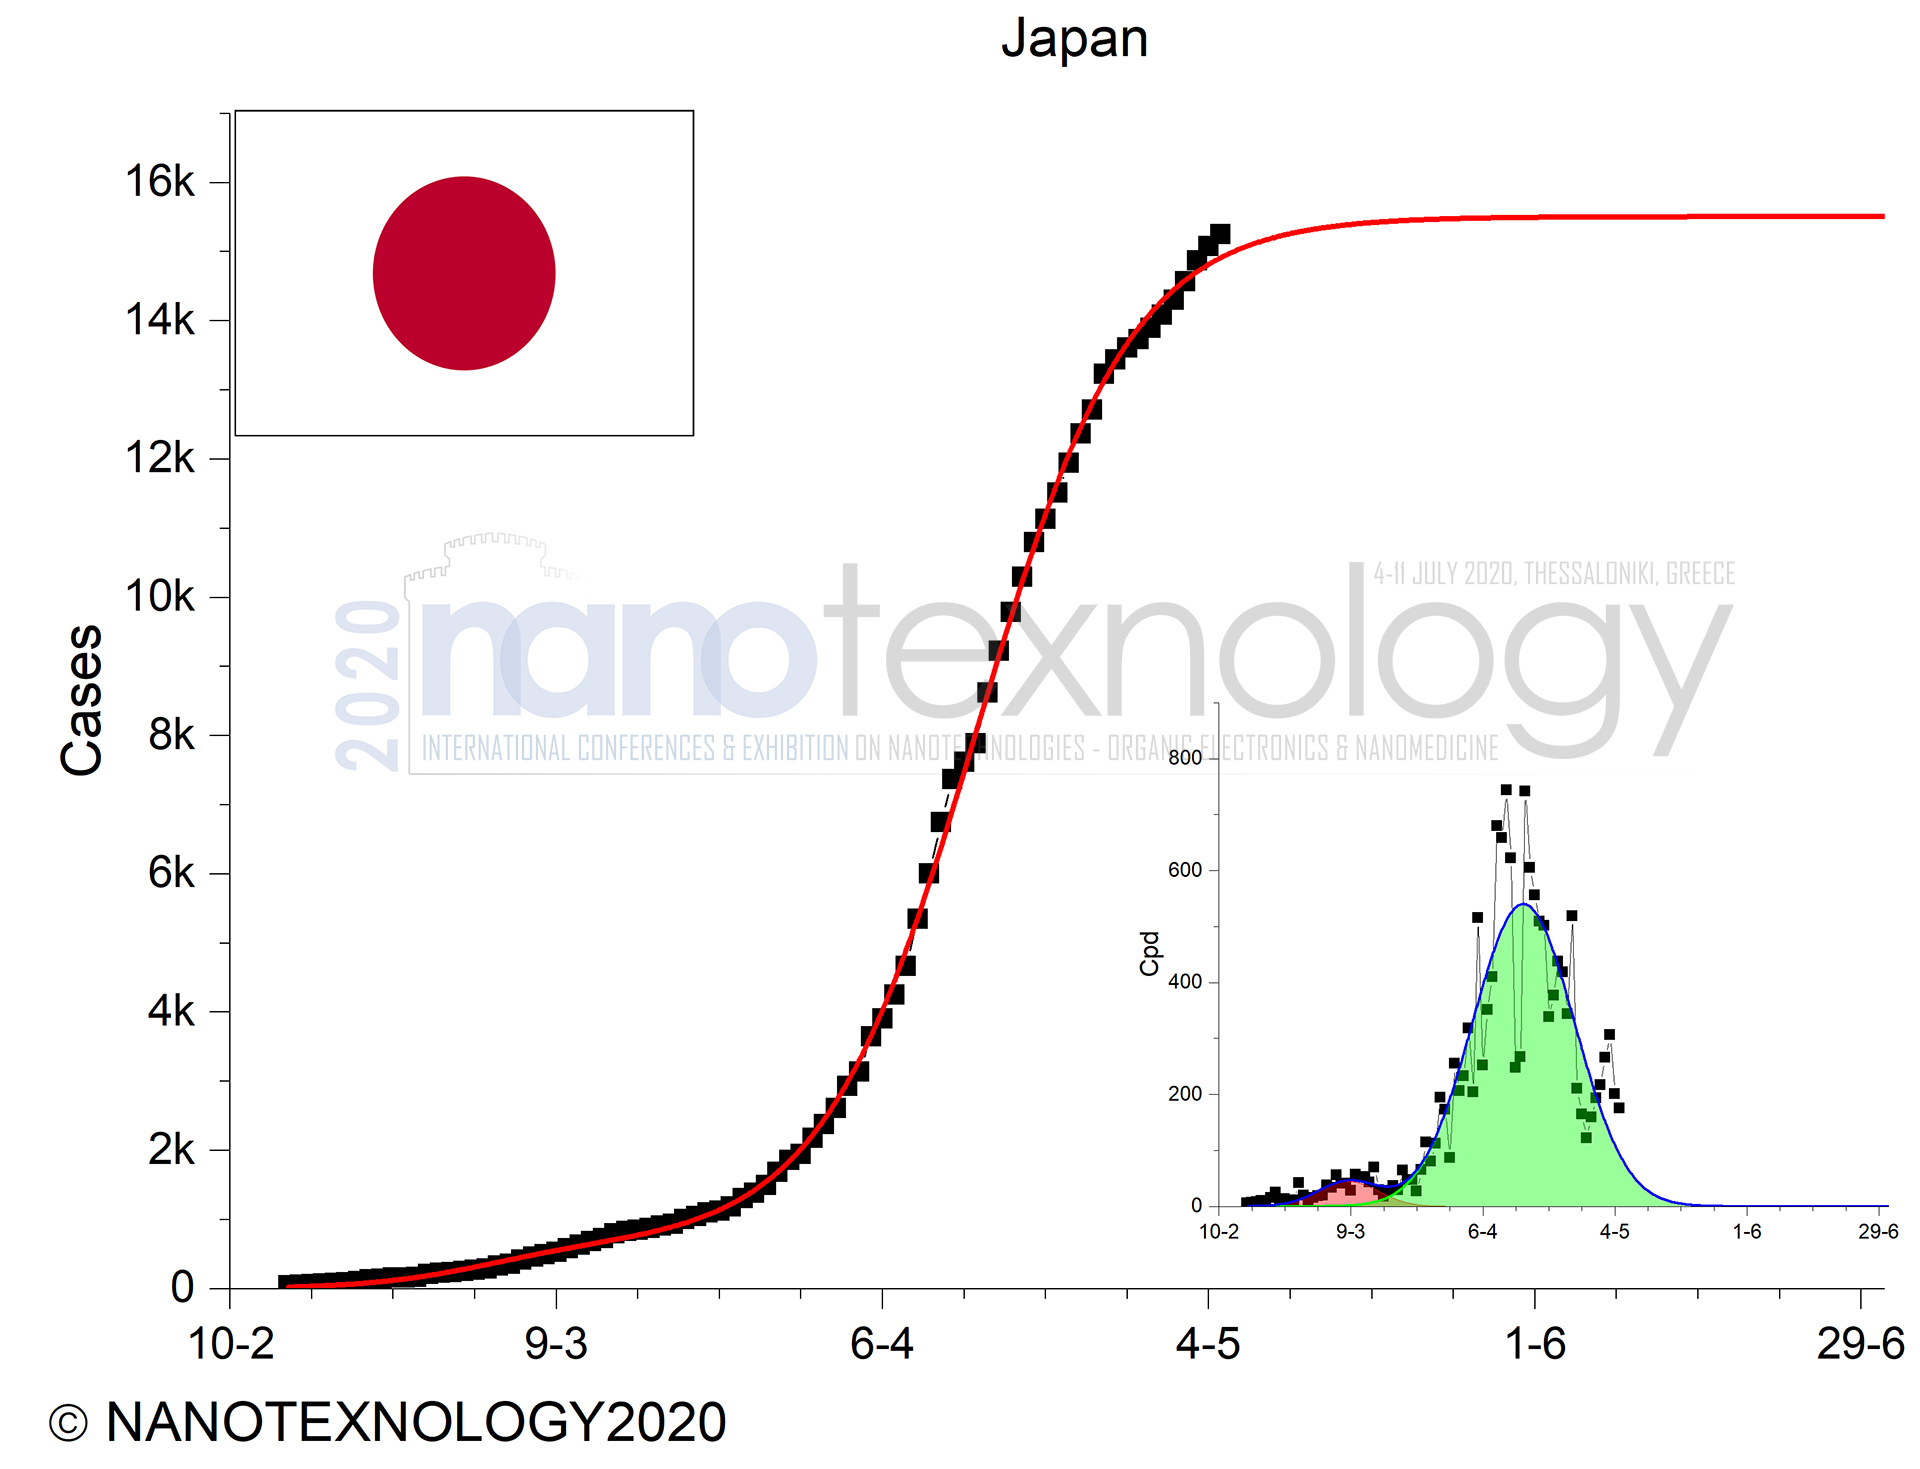
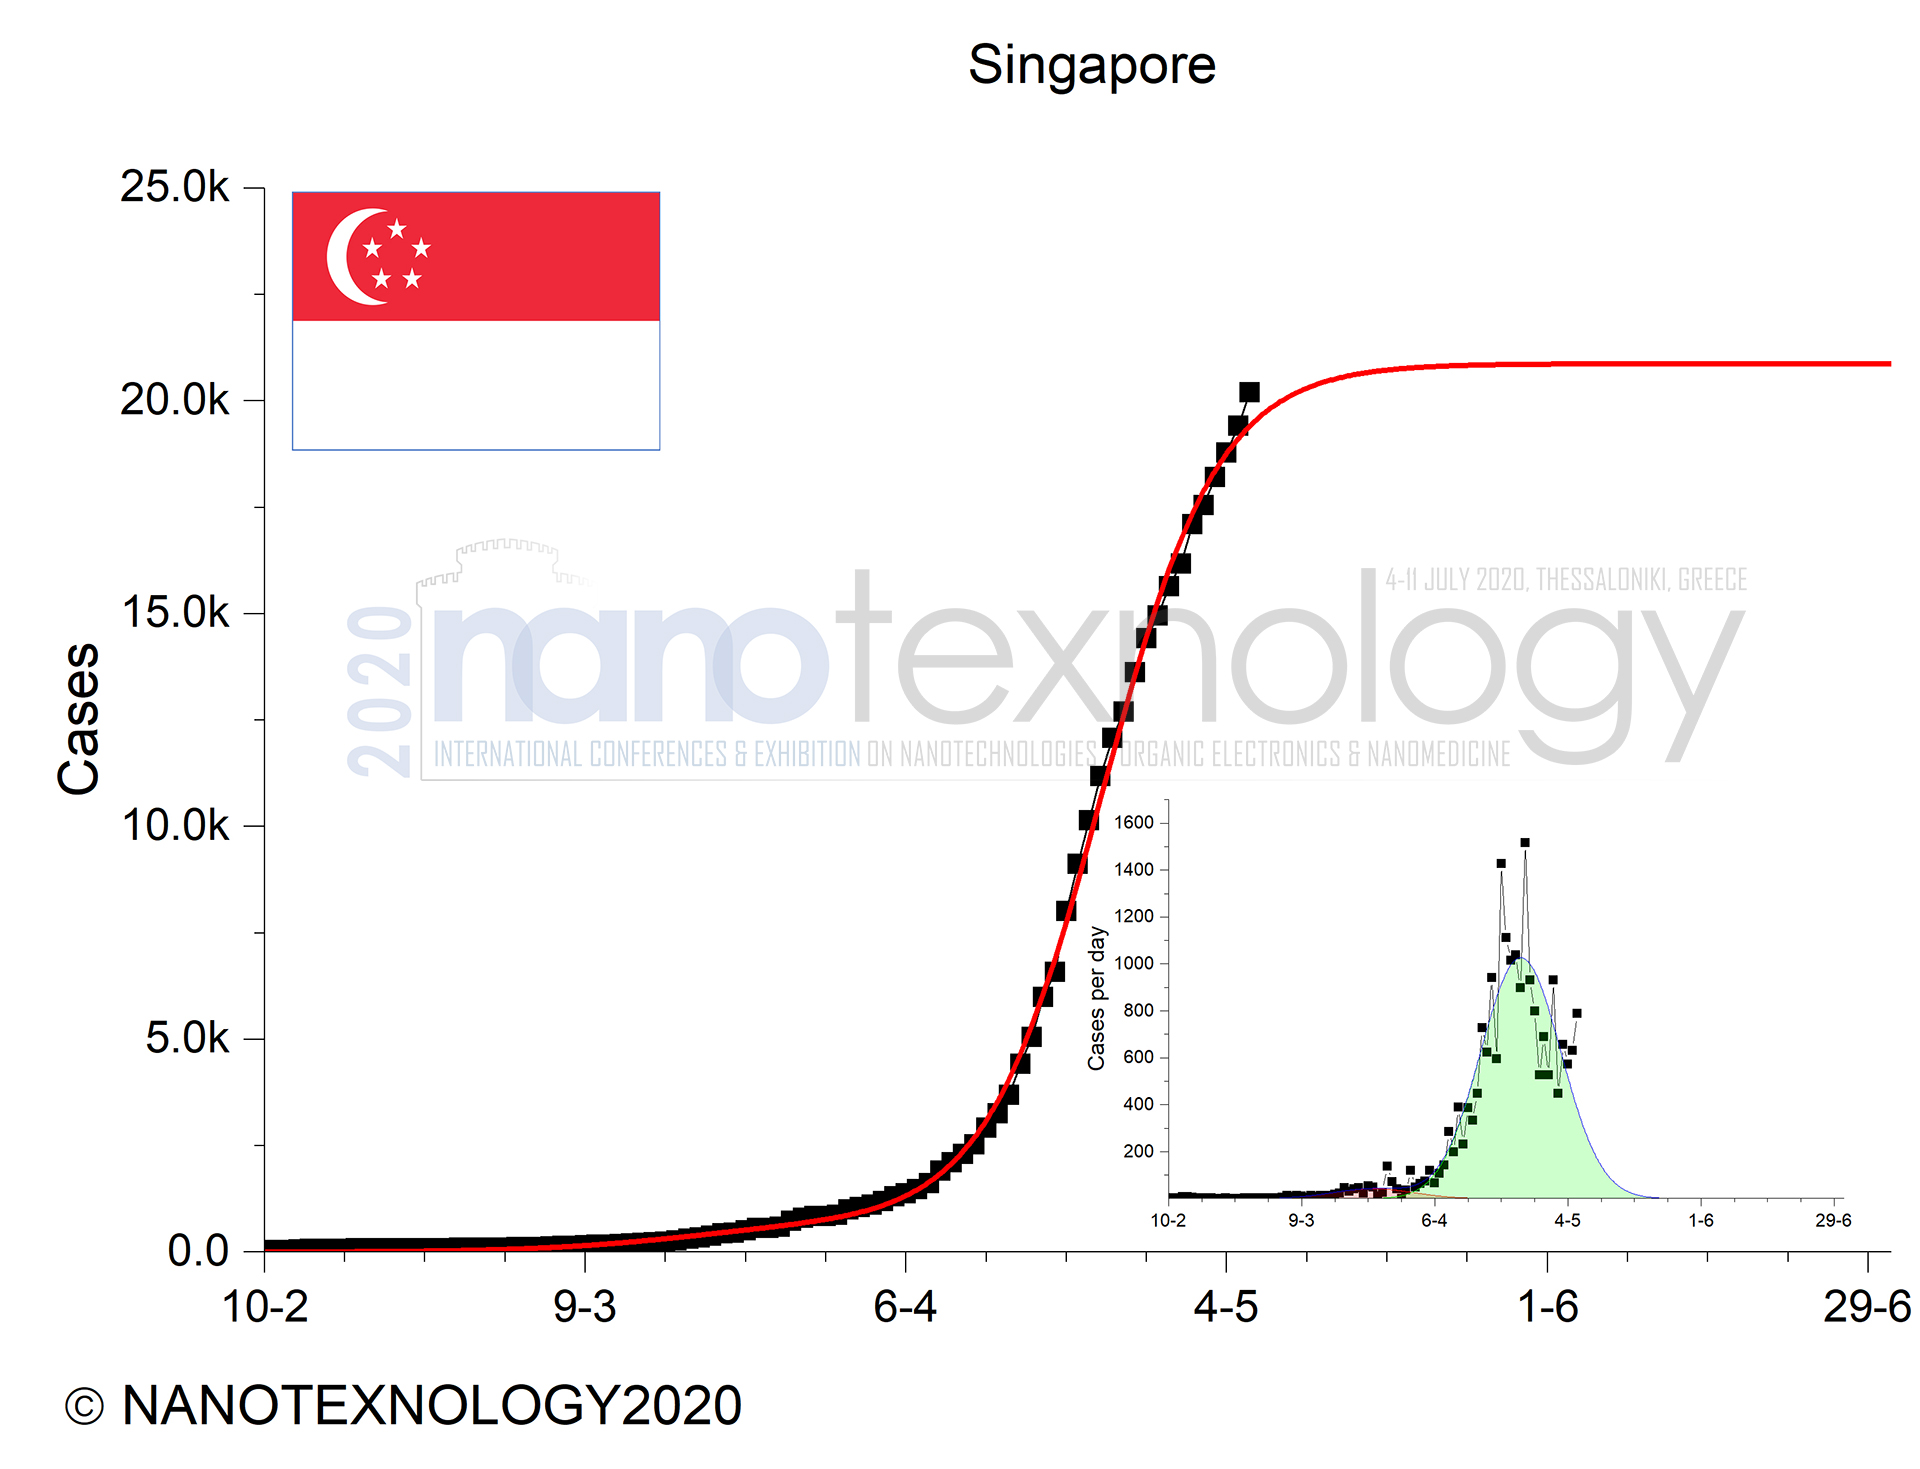
Countries in Asia such as Japan and Singapore have been very early passed the COVID-19 spread with very low cases. Surprisingly, last month both exhibited an enormous COVID-19 spread again (see Fig. 4) and now been in the end of this phase. For this reason, we are focused on their case more carefully as can be seen in Fig. 4.
 |
 |
|
Figure 4: Total and daily confirmed cases from Japan, Singapore |
||
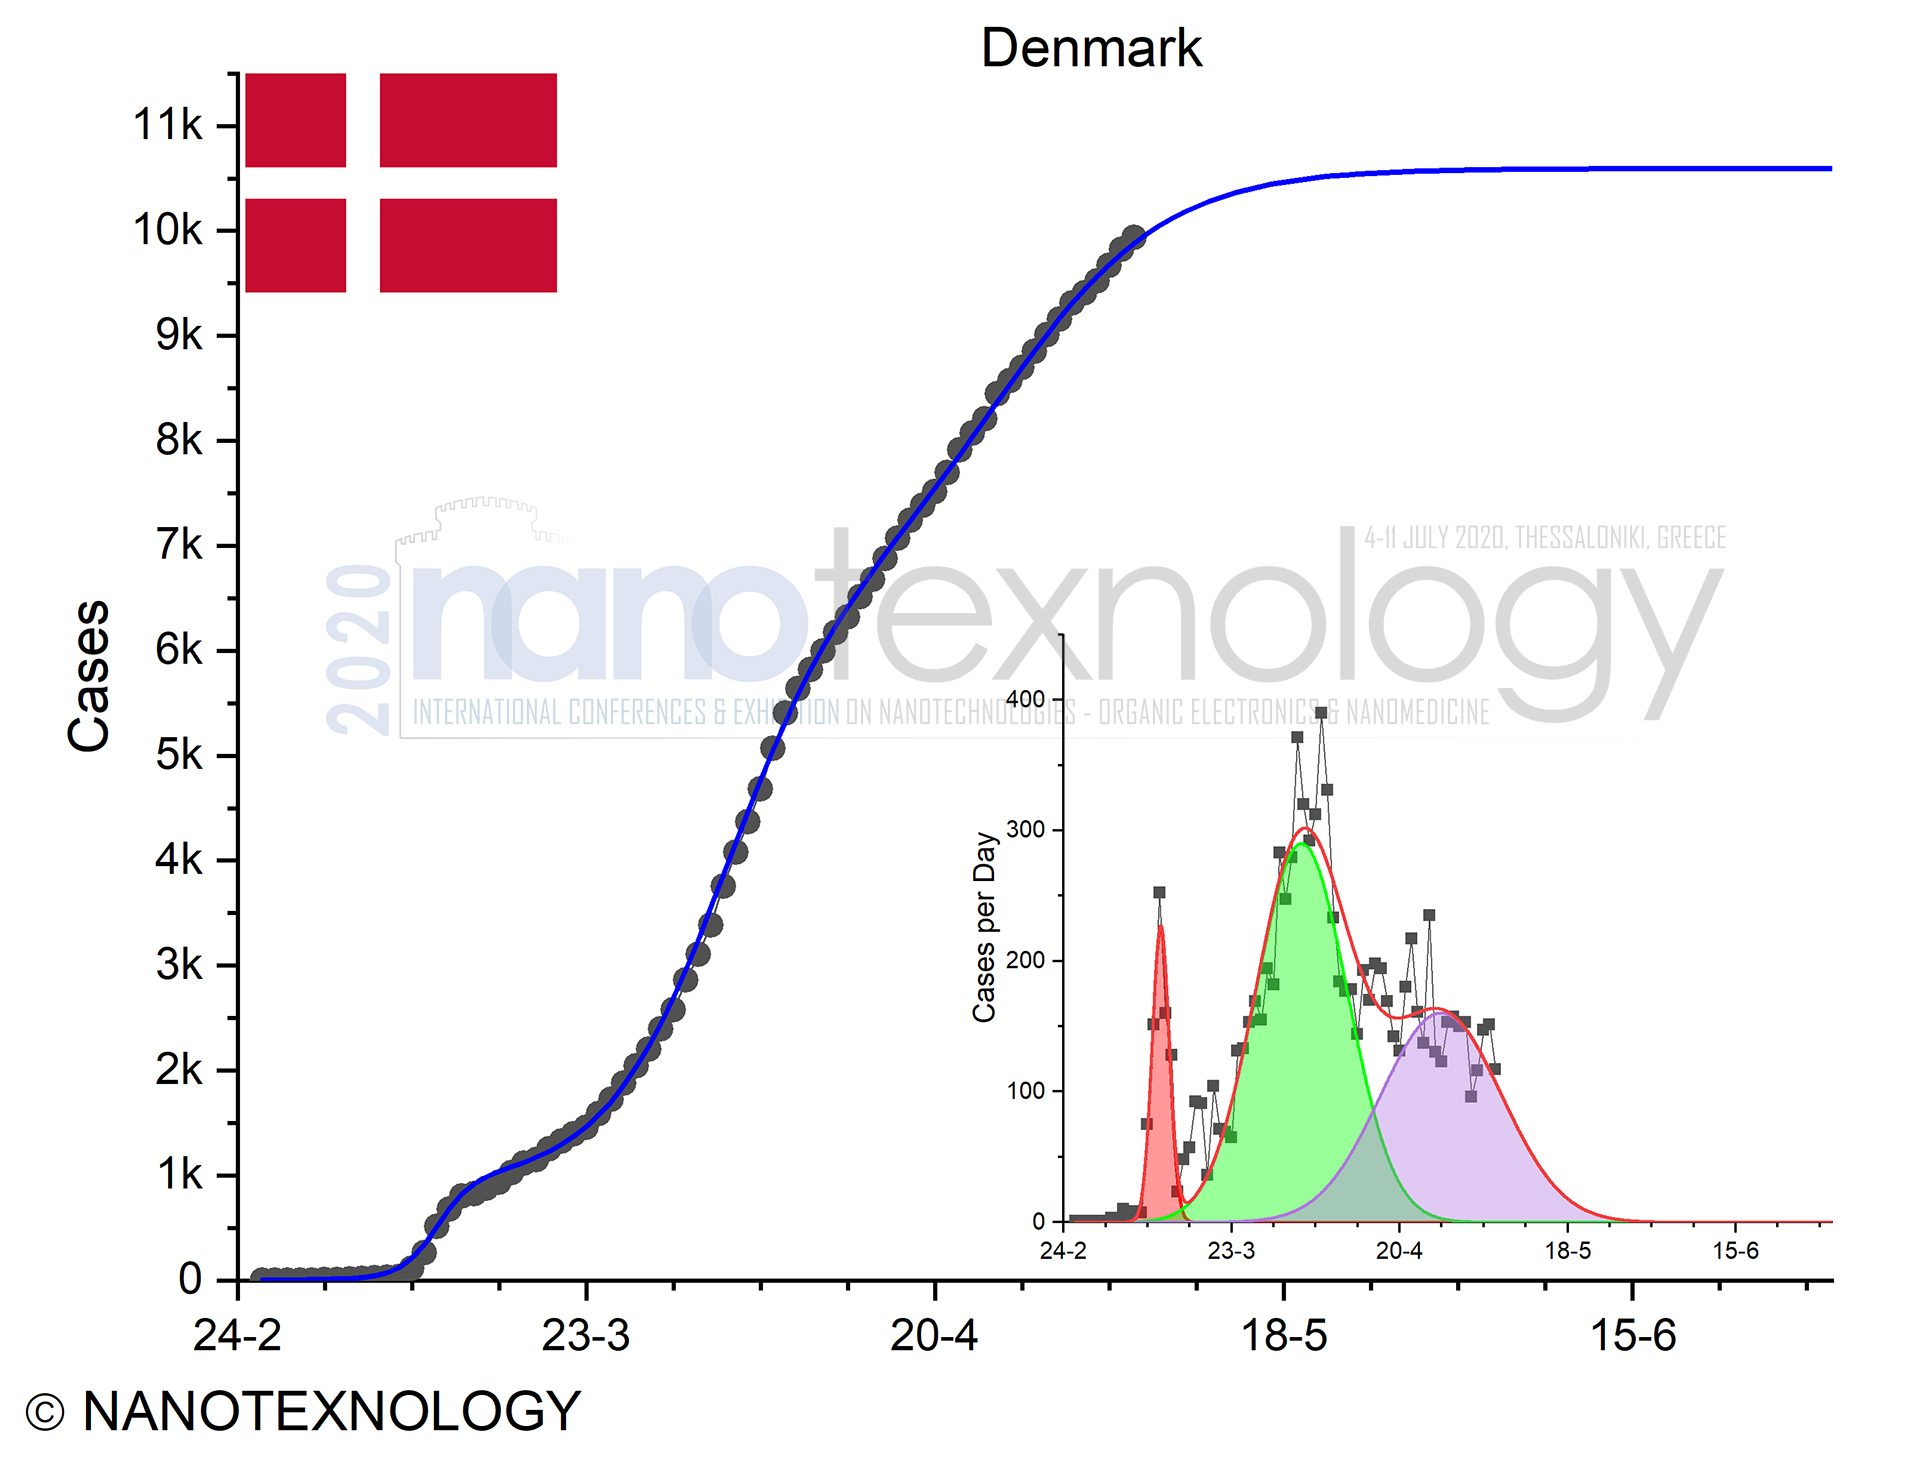
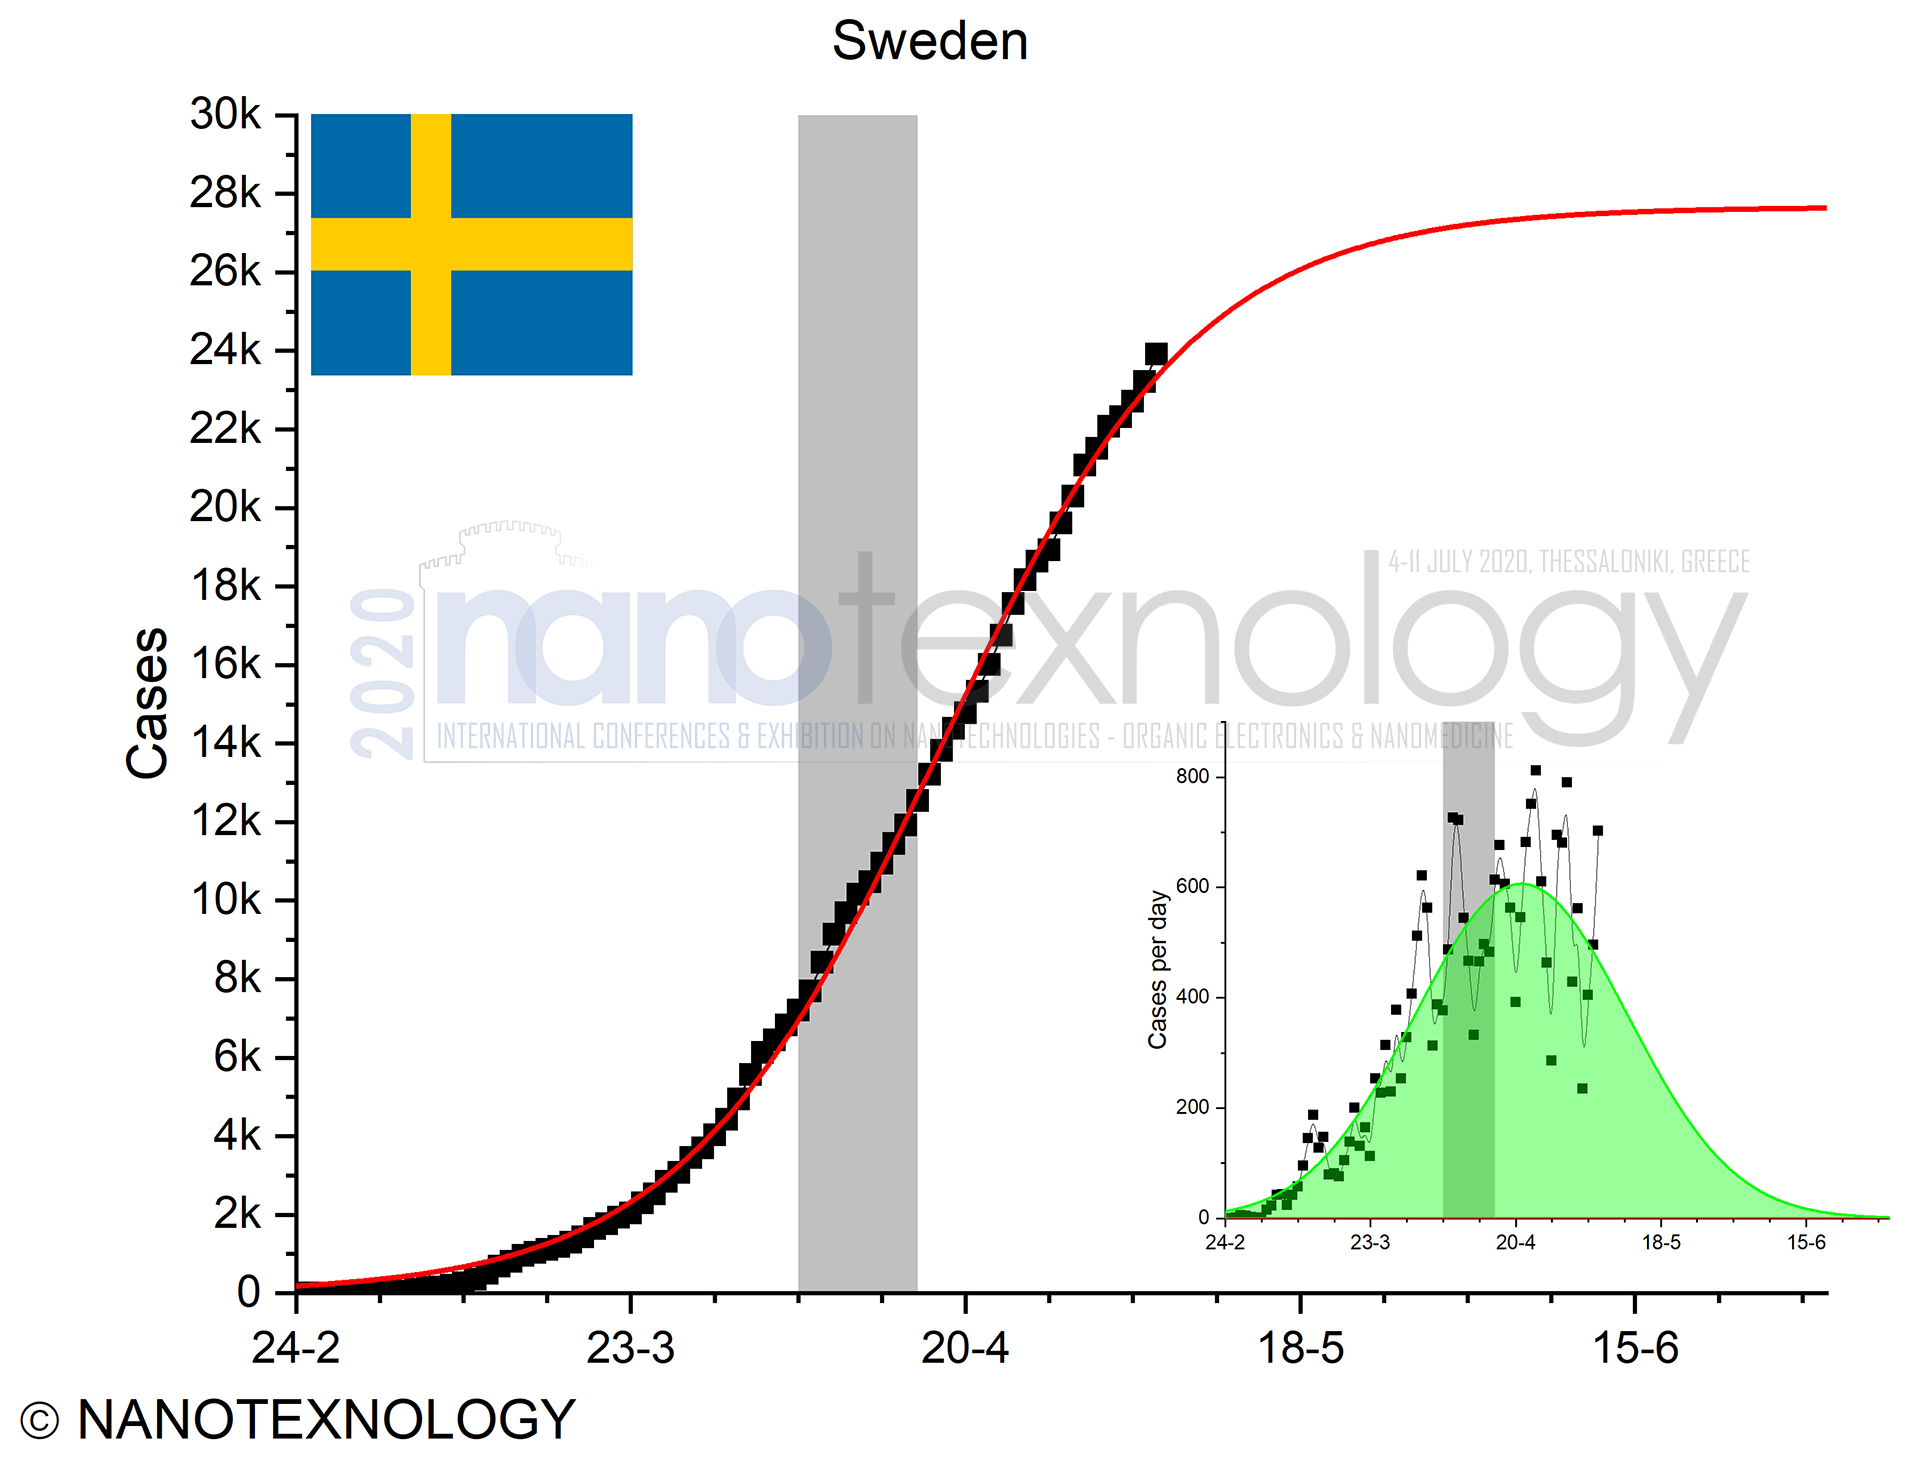
E. Sweden and Denmark two different cases
Sweden and Denmark are another case for study. These two countries showed a sharp peak in the very beginning of COVID-19 spread, and then both change plans, following by Phase one afterwards (see Fig. 5). Especially Sweden, during the last two months, seems to take measures per week in a trial an error approach. A similar with Sweden trial an error behavior it is also observed (see Fig.2) for the case of Germany. On the other hand, Denmark ended lockdown very early and now is after the middle of the second phase (according to Fig. 5).
 |
 |
|
Figure 5: Total and daily confirmed cases from Denmark and Sweden |
||
F. Worldwide, Europe, USA and Africa
Due to different reporting dates of the first case for each country we separated our study in different continents and countries as depicted in Fig. 6. Today (7th of May 2020), the confirmed cases for Europe, USA and Africa correspond to the 39%, 34% and 1.3% of World confirmed cases (excluding China), respectively. The grey and the yellow area are related to the Catholic and Orthodox Easter (2 weeks period), respectively. Utilizing the S-curve formulation it is predicted that by the beginning of June the confirmed cases for Europe, USA and Africa are expected to reach above the 35%, 32% and 1.8% of the World’s confirmed cases.
a) 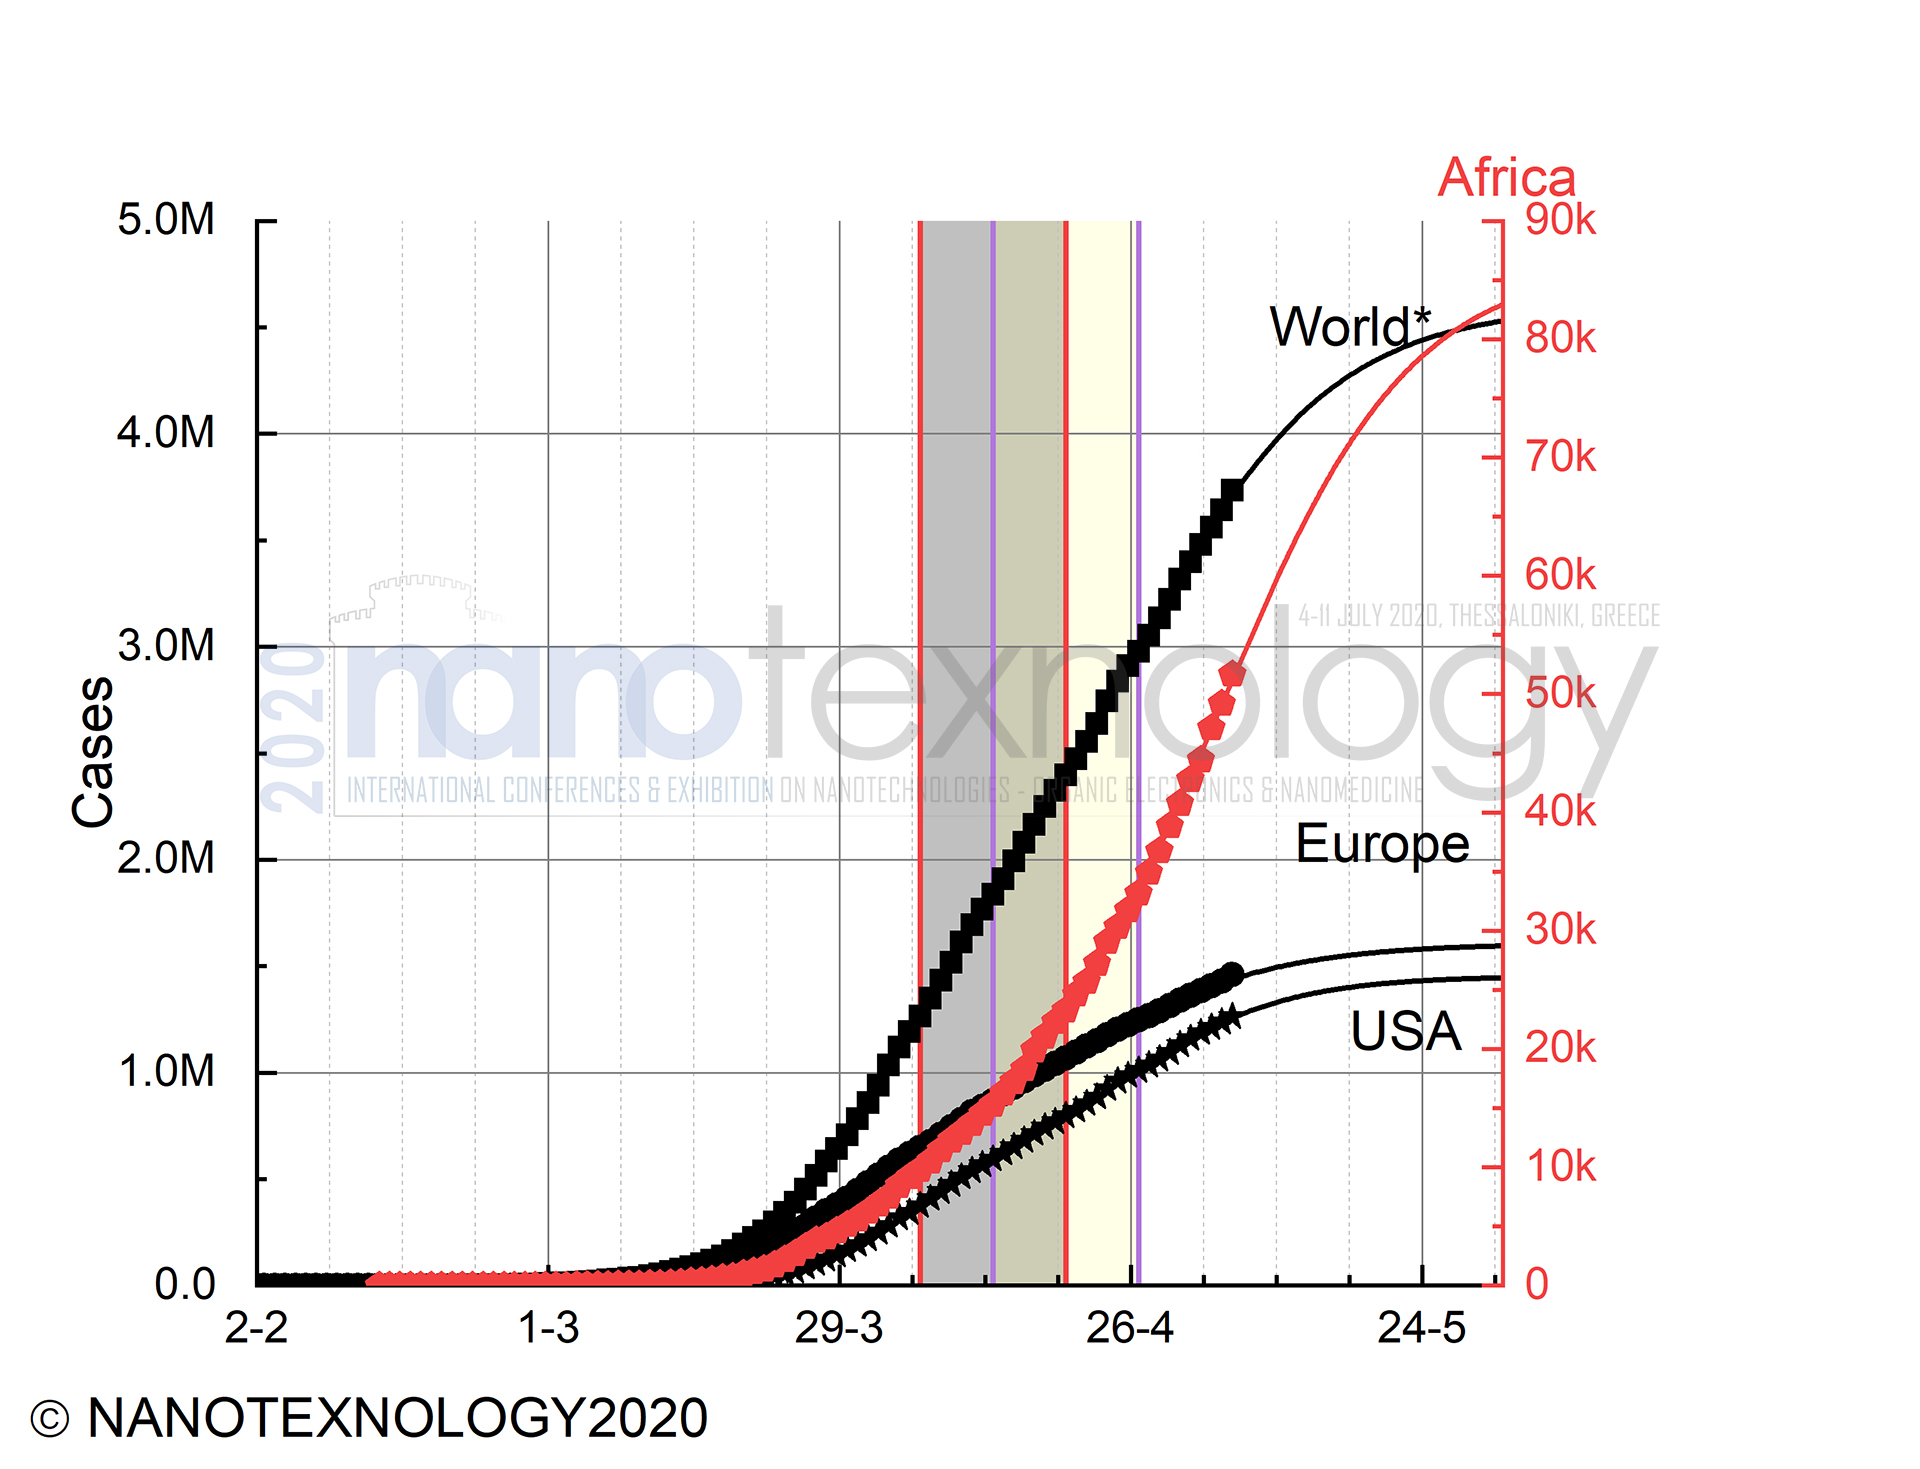 |
|
b) 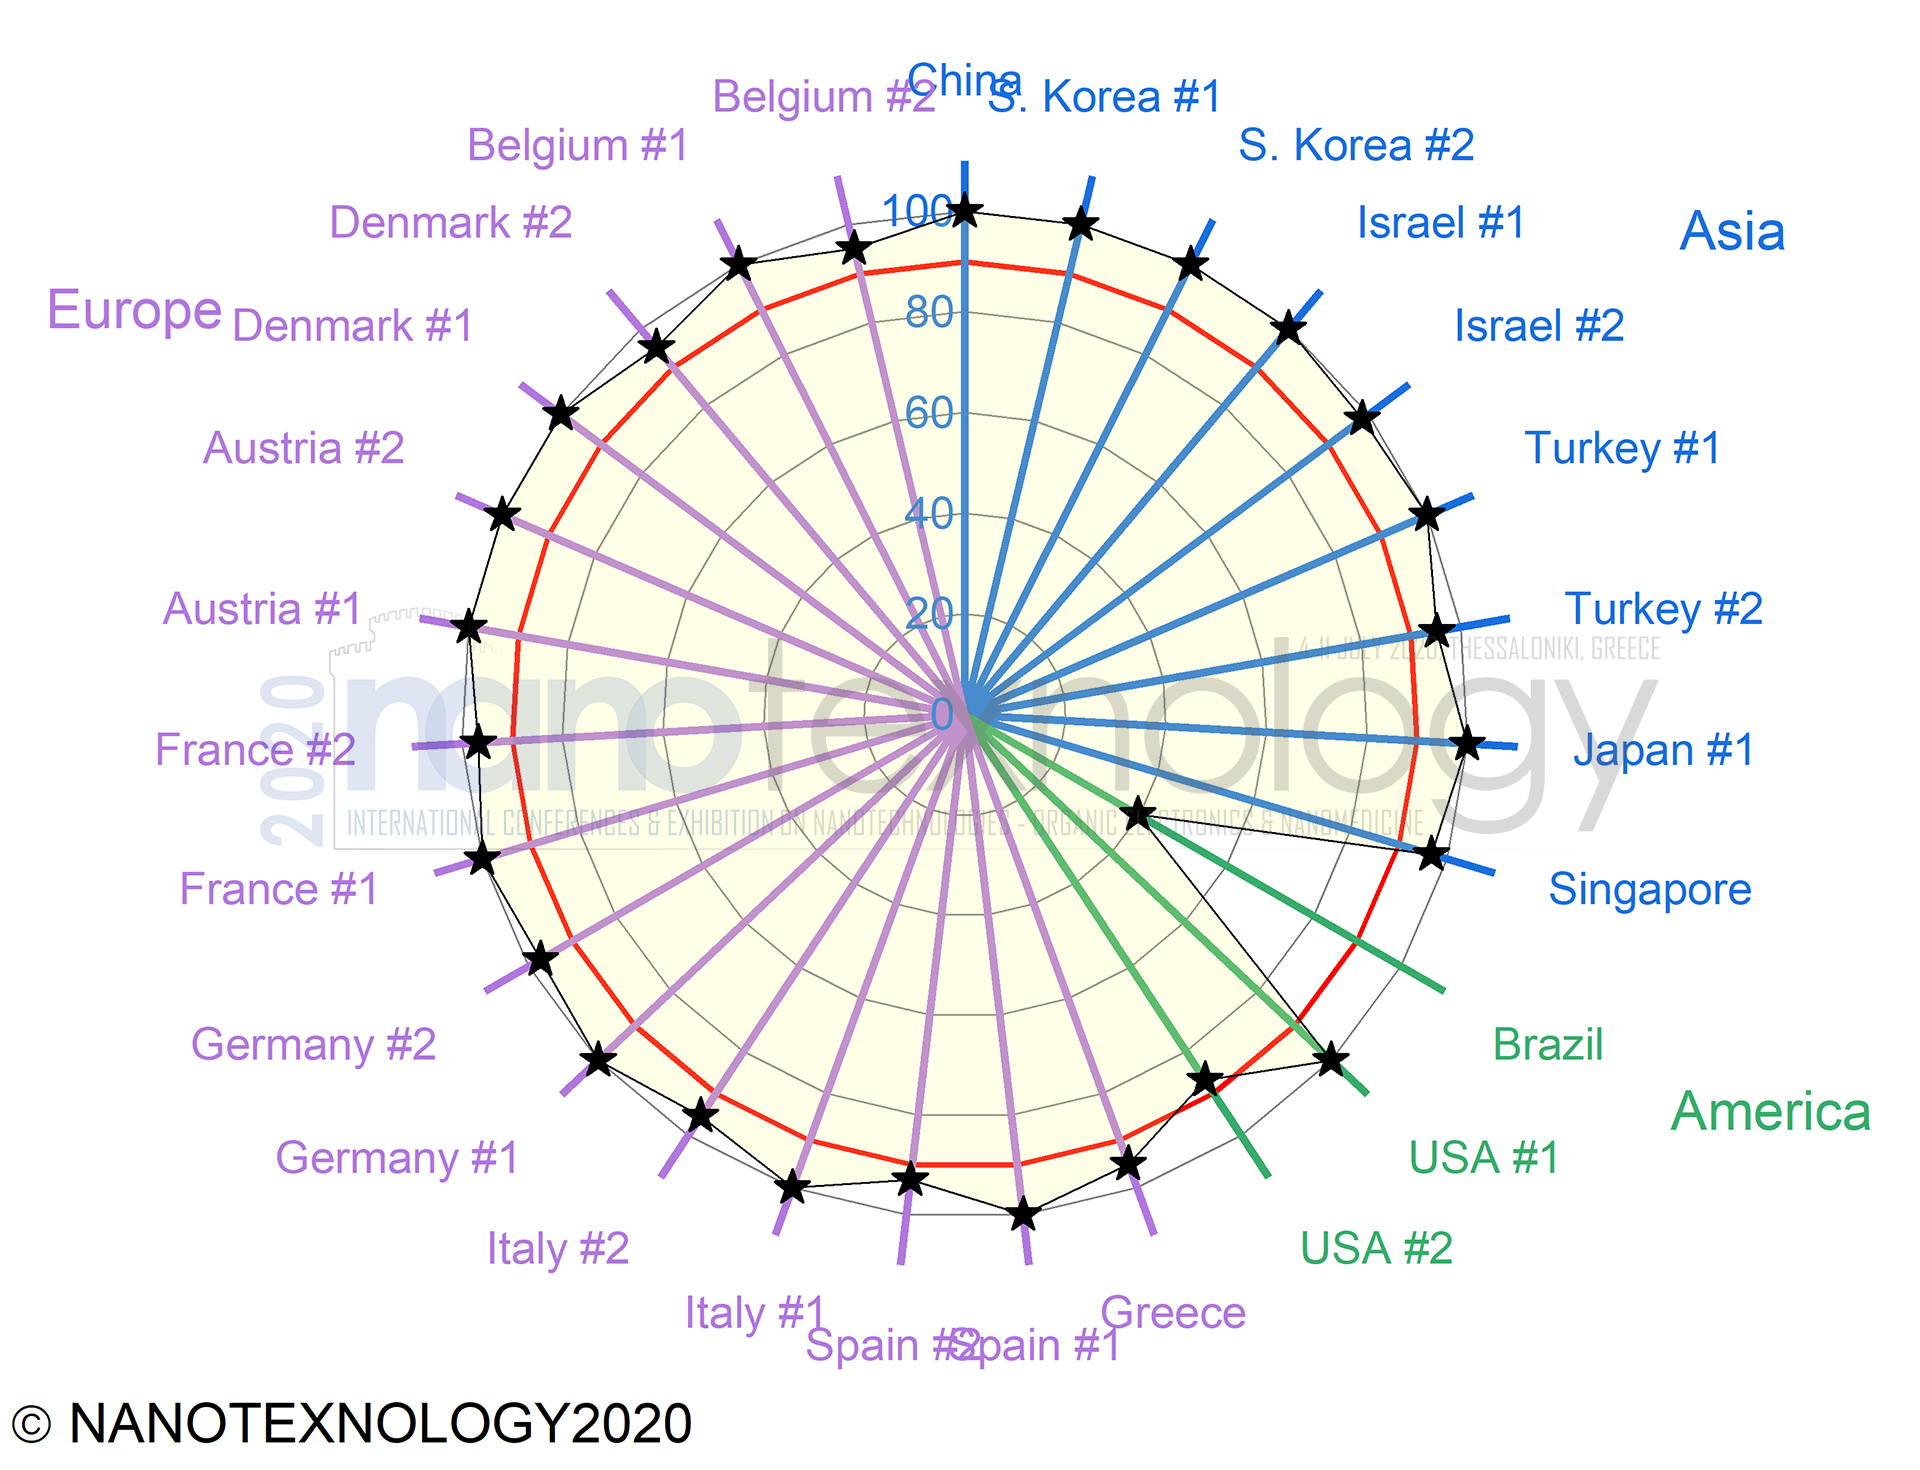 |
|
Figure 6: a) Total Confirmed Cases for World (ex China), Europe, USA and Africa and b) the radar graph for the Confirmed Cases value percentage against plateau (the red line corresponds to the 90% of Plateau value). #1 and #2 correspond to the country phase one and phase, respectively. |
|
Copyright © NANOTEXNOLOGY. All rights reserved.